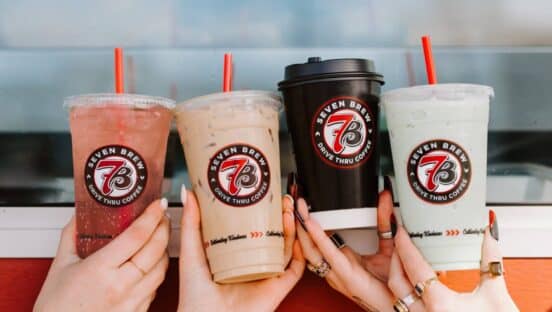
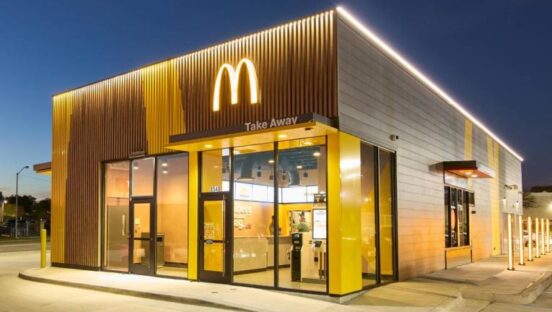
Once smoothies and frappés were in the pipeline, McDonald’s wasted no time making another splash with beverages. Reports that the chain would reprice all sodas at $1 initially drew scoffing—from franchisees as much as competitors. But within weeks the home office confirmed to QSR that “many local markets” had already adopted the discount. Now units are being revamped into places where you might kick back with your latte, frappé, or$1 Coke.
As for closest competitor Burger King, the roll out of a new charbroiler, the foundation of the brand’s open-flame cooking process, opened the menu to products like ribs and stuffed burgers. But it remains to be seen if the company will rally a franchisee community that all but yelled “Death to the King!” during the past year’s deep discounting. Some fear the brand has conditioned customers to shop for price, quality be damned.
Wendy’s is focusing on prepping for a breakfast re-entry and what CEO Roland Smith termed a “significant” facelift for stores. But the new a.m. lineup won’t be available systemwide until late 2011.
| Segment Rank |
2010 QSR 50 Rank |
Chain | U.S. Systemwide Sales ’09 (millions) |
U.S. Average Annual Sales Per Unit ’09 (Thousands) |
Franchised/ Licensed Units ’09 |
Company- Owned Units ’09 |
Total Units ’09 |
| Burgers | |||||||
| 1 | 1 | McDonald’s | $31,000.0 | $2,350.0 | 12,402 | 1,578 | 13,980 |
| 2 | 3 | Burger King | $9,000.0 | $1,240.0 | 6,333 | 917 | 7,250 |
| 3 | 4 | Wendy’s* | $8,388.0 | $1,422.0 | 4,622 | 1,255 | 5,877 |
| 4 | 10 | Sonic | $3,837.4 | $1,093.0 | 3,069 | 475 | 3,544 |
| 5 | 13 | Jack In The Box | $3,072.1 | $1,420.0 | 1,022 | 1,190 | 2,212 |
| 6 | 16 | Dairy Queen* | $2,640.0 | $530.0 | 4,469 | 71 | 4,540 |
| 7 | 19 | Hardee’s* | $1,660.0 | $1,002.0 | 1,430 | 475 | 1,905 |
| 8 | 22 | Carl’s Jr.* | $1,370.0 | $1,438.0 | 802 | 422 | 1,224 |
| 9 | 24 | Whataburger | $1,178.9 | $1,679.0 | 173 | 529 | 702 |
| 10 | 27 | Steak 'n Shake* | $753.8 | $1,500.0 | 73 | 412 | 485 |

