Is it a matter of if, not when consumers begin to push back against surging quick-service prices? There’s no crystal answer at the moment, with most brands reporting little, if any, pushback thus far. The concern, however, isn’t whether or not guests are willing to pay up today at this upward turn in the COVID recovery, but how long spending habits hold. Especially as gas prices continue to press disposable income.
Revenue Management Solutions has conducted quarterly surveys among consumers throughout the pandemic. One question it asks, “What is causing dissatisfaction from the quick-service restaurant experience?” has begun to shift. Last go-around, price ranked fourth behind long wait times, order inaccuracy, and poor customer service. This feels a reflection of where transactions moved as much as historic trends. If you switch to ask, “What is causing dissatisfaction from the drive-thru experience?” for instance, all of those metrics are line up with how convenience standards accelerated outside the four walls.
READ MORE:
25 Consumer Trends Restaurants Will See in 2022
Where Does the Restaurant Industry Go from Here?
The Restaurant Franchising Industry is Nearly Fully Recovered
Why the Pandemic Only Made Fast Casual Stronger
Restaurants After COVID: An Industry for the Better?
Why Value Will Make a Fast-Food Comeback in 2022
For full-service restaurants, price ranked as the third most common reason for dissatisfaction. Long wait times and poor customer service were ahead. Again, a measure of life in a world of pent-up demand dining: packed lobbies; customer service held to a higher bar since dining out is now a celebratory event for more than just birthdays.
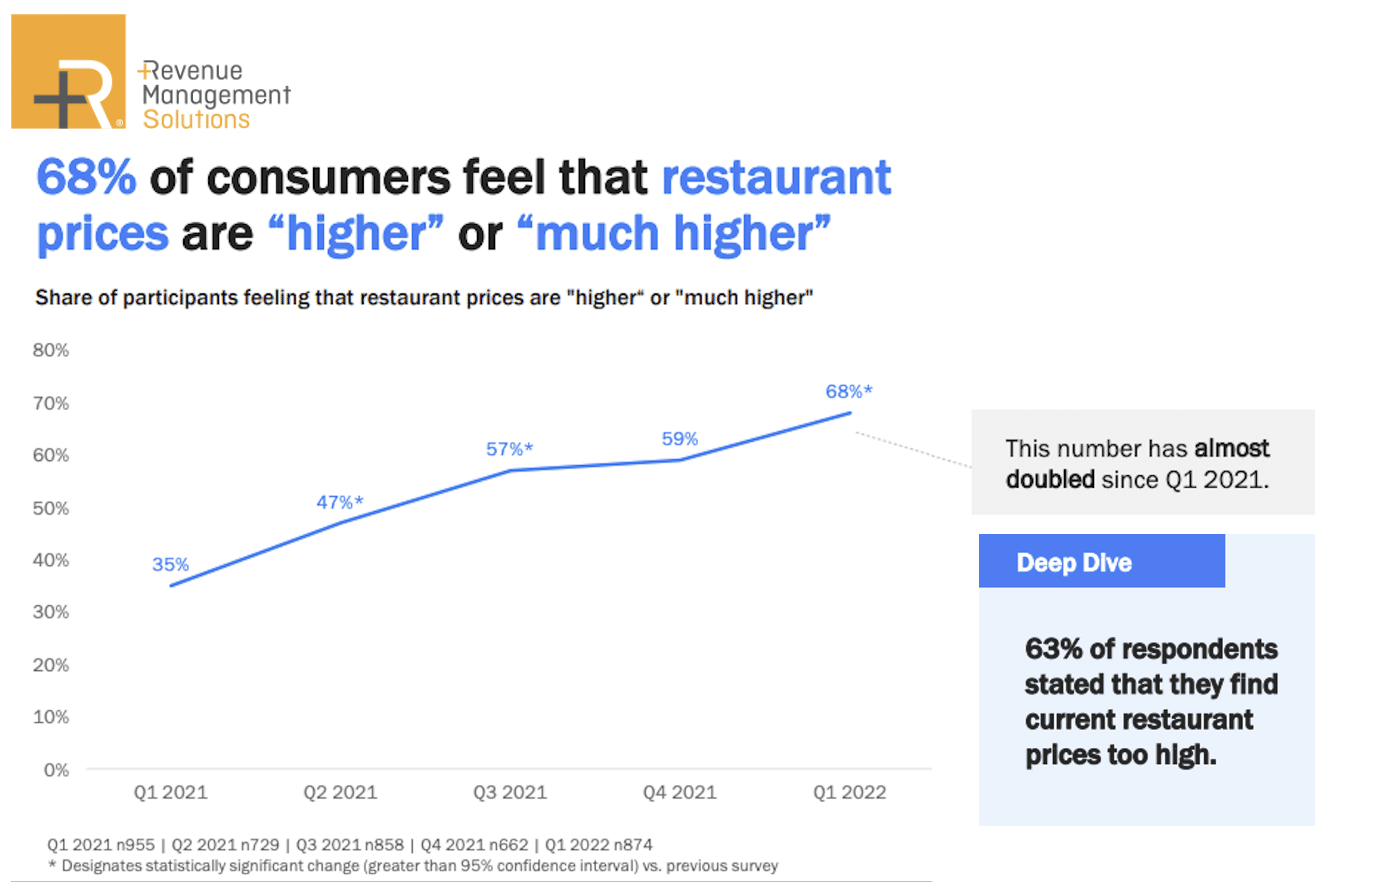
Turning to the present, RMS’ latest dive found 68 percent of consumers presently feel restaurant prices are higher, or much higher—nearly double the percentage (35 percent) compared to Q1 2021.
When asked why they were getting less value from a restaurant visit, 82 percent credited “higher prices.”
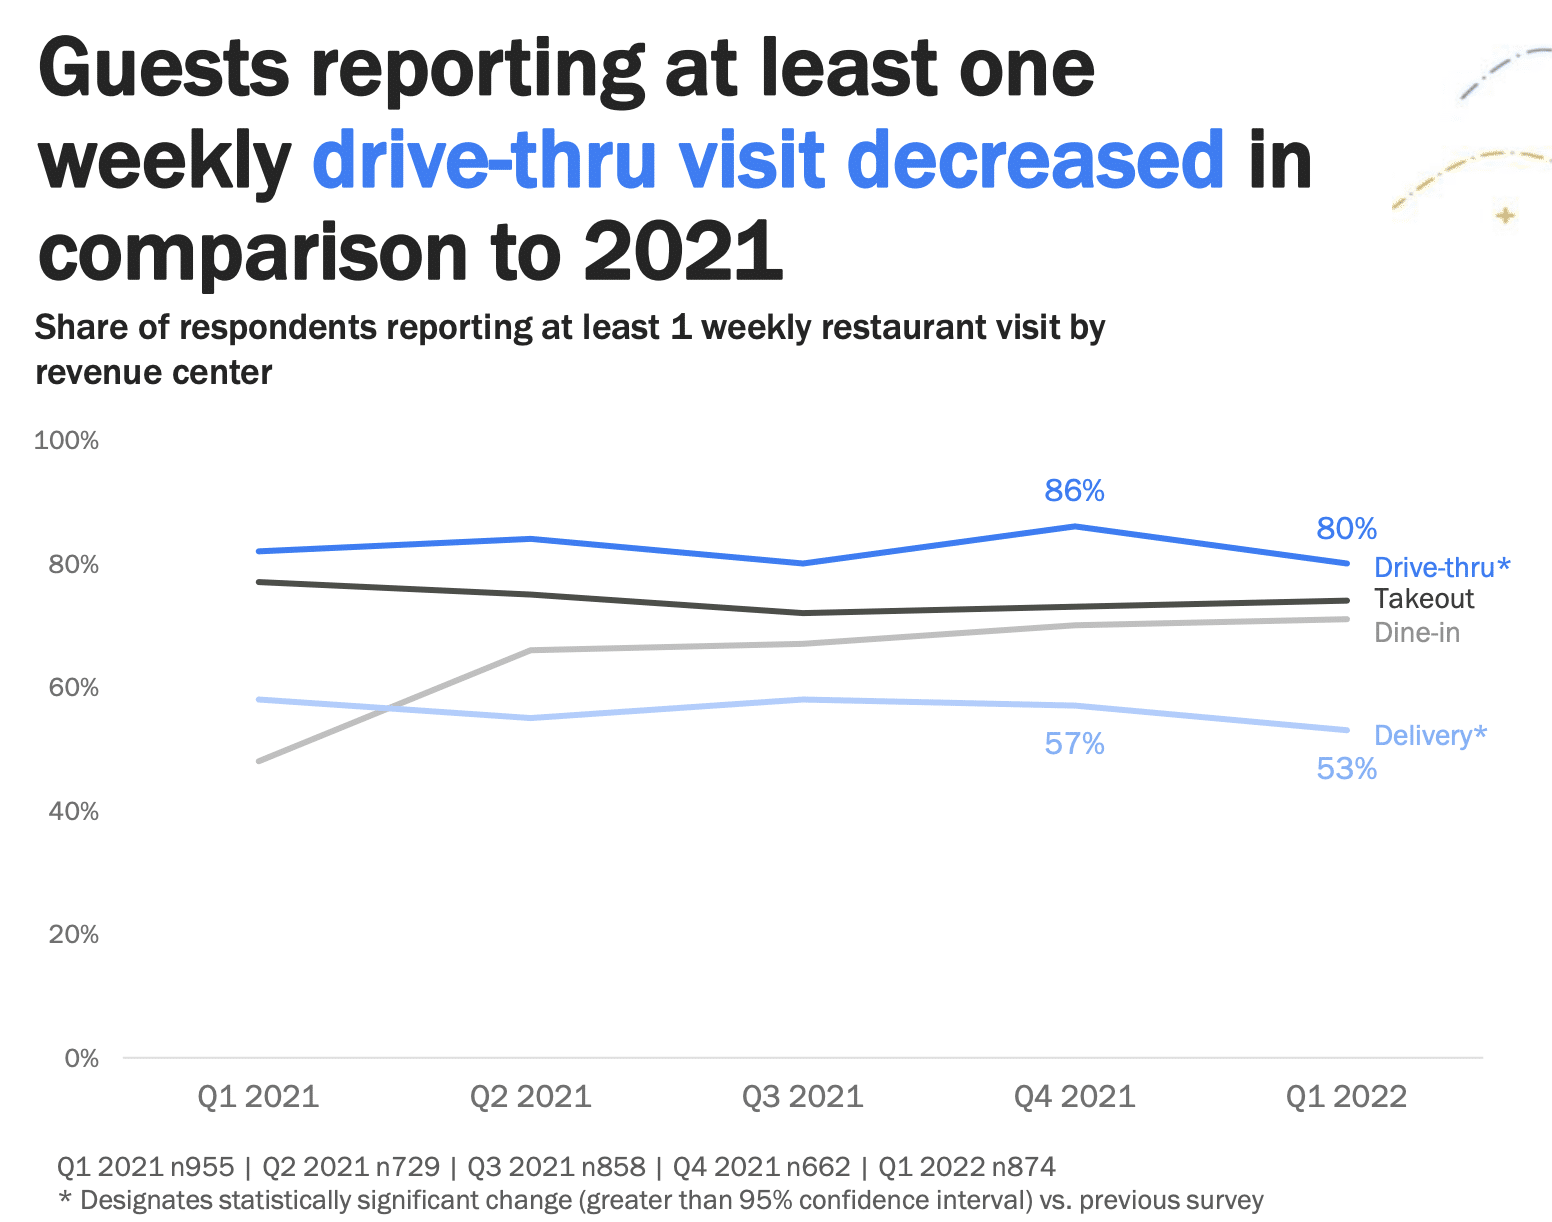
Reported visits to drive-thrus and quick-service restaurants decreased compared to 2021 (the survey took place from March 4 to March 7). Overall restaurant visits also witnessed a decline in the beginning of the year.
RMS believes the delivery pullback ties to price premiums and service charges in the inflationary upswing. Shake Shack, in one case study, said in February it expected to take 6–7 percent of price as the brand headed into Q2. Typically, it pushes only 2 percent per year. It also shared it was on the verge of raising third-party delivery figures from 10–15 percent higher than in-store.
Industry-wide, the food away from home index rose 6.8 percent in February, year-over-year, which was the largest 12-month increase since December 1981. Limited-service meals rose 8 percent year-over-year.
MORE: Meet the barbecue brand with an “Inflation Menu”
Guests reduced their frequency across all dining segments in RMS’ data, with just 21 percent reporting they ordered “more or much more” from a drive-thru than in the past month. In fast casual, 13 percent ordered more. Twelve percent ordered more with dine-in.
Similarly, consumers reporting at least one weekly dining occasion slumped in all categories except dine-in.
This isn’t necessarily as alarming as it appears. Consumers generally eat out more during Q4’s holiday rush. Beyond the social aspect, people tend to tighten their wallets in Q1 to recoup and realign.
Thirty-seven percent of respondents reported spending less of their disposable income on restaurants. Of the thrifty ones, 46 percent said they were ordering less from restaurants and about one in three consumers were ordering less expensive items or choosing less expensive restaurants.
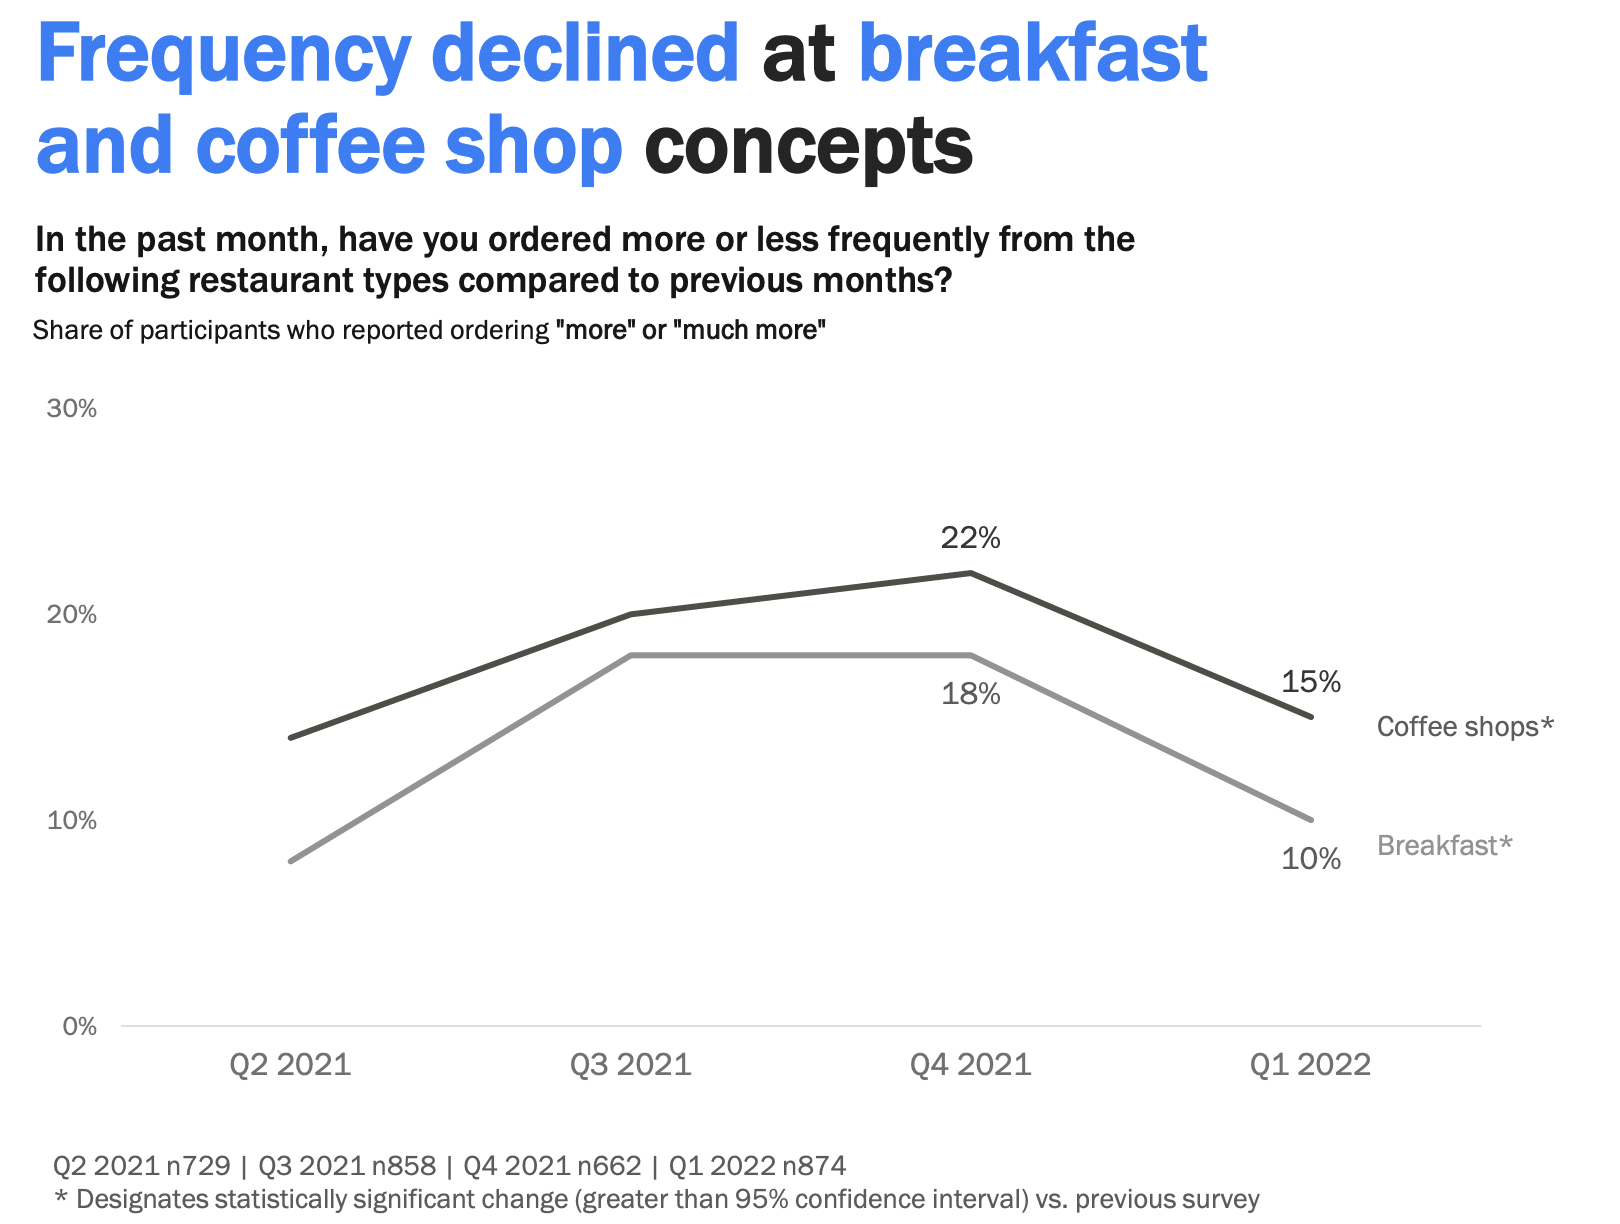
In RMS’ study, coffee shop occasions are dropping, too. Could this be an inflation kickback as well? Only time will reveal, but here’s the current pull back:
Frequency slid in Q1, with 15 percent reporting that they visited a coffee shop “more or much more” in Q1 2022 compared to 22 percent in Q4 2021 (and about even with Q2 2021, when the country was, broadly, still quarantined).
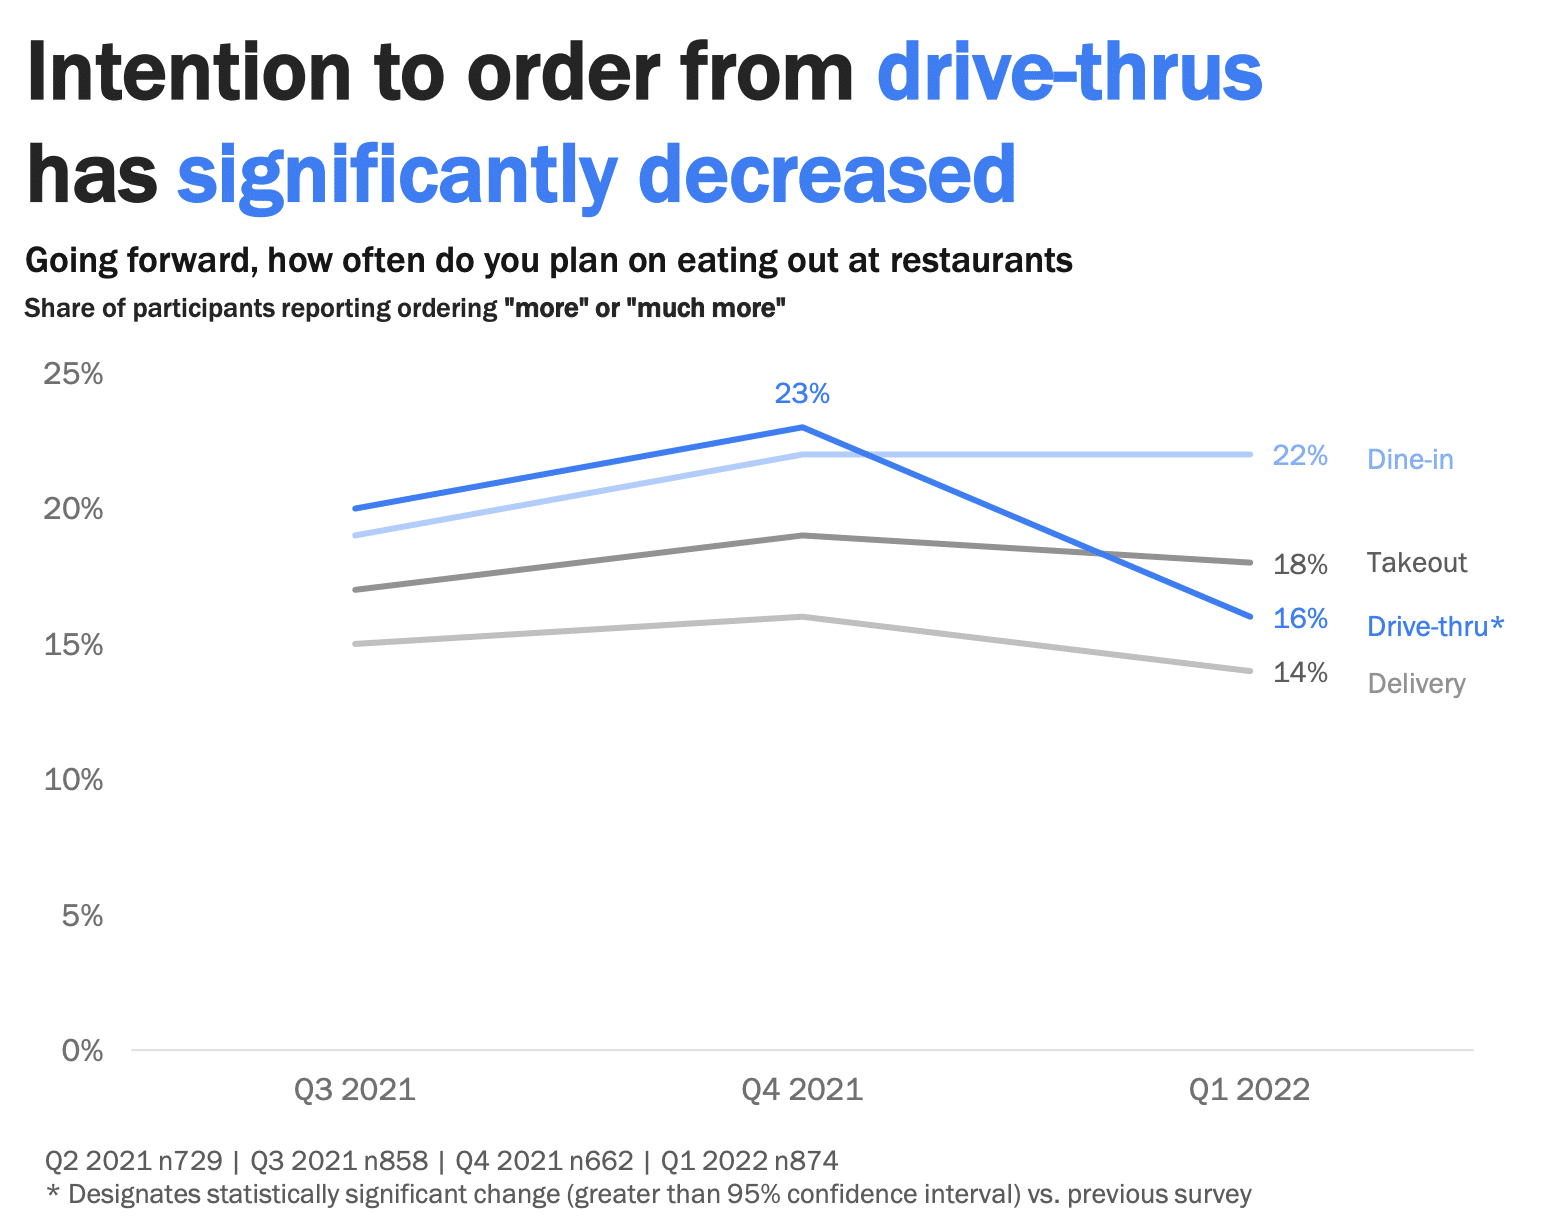
Intention to order from drive-thrus has fallen, too, as the below chart shows—a steep line from 23 percent in Q3 to 16 percent in Q1. History suggests higher gas prices negatively impact drive-thru traffic, particularly in respect to vacation trips, highway stops, and the like.
Some other results:
RMS found nearly three in five people said they cook more at home now compared to 20221. When socializing with friends, 45 percent said they’re entertaining less at home versus a year ago.
When celebrating special occasions, though, 31 percent were more likely to go to a restaurant over cooking at home. RMS said these points illustrate what could be lasting imprints of the crisis: Consumers have learned to cook more everyday meals at home and are sticking to that; and yet when it comes to entertaining and spending time with friends and family, they’re taking the party back to restaurants, as it once was.
Pre-COVID, about 49 percent of all calories consumed came from restaurants. The pandemic simply provided a huge jolt to the system.
According to Simon-Kucher & Partners, a global strategy and marketing consulting firm, home-cooked meals accounted for 33 percent of consumption before 2020. Food away from home represented 67 percent.
During COVID, it changed to 55 and 45 percent, respectively. Early surveys, the company said, figured that might settle at 37 and 63 percent. If you go by the National Restaurant Association’s $898 billion sales projection ahead of the virus, a 4 percent shift falls somewhere in the realm of $50 billion in annual sales restaurants will end up chasing.
Currently, the industry doesn’t appear there yet, with demand in and outside restaurants pushing sales above 2019 benchmarks for many brands. Yet it’s a potential share-of-stomach challenge on the horizon.
The restaurant industry is projected to earn $898 billion in sales this year (two years behind schedule), which is an increase from $864 billion in 2019, per the Association. But in terms of real sales—adjusted for inflation—2022’s target is expected to be a 11.5 percent decline compared to three years ago.
Speaking to the demand, however, 51 percent of adults in the Association’s State of the Industry report said they aren’t eating at restaurants as much as they’d like, which is up 6 percentage points from January 2020. Also, 37 percent said they’re not ordering takeout or delivery from restaurants as often as they’d like, which is 7 percentage points below January 2020. Off-premises has become a stick corner of the transaction debate.
And perhaps returning to where price factors in, the pent-up demand differed based on household income. Sixty percent of consumers with household incomes below $50,000 noted they wanted to go to restaurants more frequently; 30 percent in households incomes above six figures weren’t eating out as often as they’d like.
Overall, 63 percent of adults—including 75 percent of millennials and 70 percent of Gen Z—said “restaurants are an essential part of their lifestyle.”
In Black Box Intelligence’s April 6 update, the company said softer spending from older guests remains a hurdle. Spending by 25- to 44-year-old diners had “modestly” eclipsed pre-pandemic levels.
Leading that weakness was the 65-plus grouping. Their spend showed the largest improvement since the rollout of vaccines. However, it’s still below all age cohorts from a spend level standpoint, as well as share of spend. Continued health risk aversion is likely the biggest contributing factor in the softness, Black Box said, followed by less growth in income (trailing wage growth, lower interest rates on investments), and the impact of inflation.
Meanwhile, 18- to 24-year-olds provided robust spending growth. “Younger guests are experiencing strong work prospects, with rapid wage hikes, and increasing job openings, as well as benefiting from recent stimulus and the student loan pause,” Black Box said. Today, their spend is up nearly 20 percentage points and accounts for roughly 9 percent of spend mix.
Younger consumers are providing a tailwind. The largest spend gain (in full service) was from the sub-34 age cohort, while 18- to 24-year-olds led on a percentage growth basis, per Black Box, up more than 26 percentage points from pre-COVID. For limited-service guests 45 and above, they, too, hiked spend compared to 2019, but to a lesser extent.