Convenience is not a pandemic-created trend. While it feels like another century, finding ways to deliver food to busy consumers was one of the top-tier movement pre-COVID-19. Two years ago, at the National Restaurant Association show, a bevy of products hit the showroom floor focused on cook times and producing “made-from-scratch” items quickly. And then the technology wave arrived.
Just concerning delivery, it’s a sector that’s ballooned 20 percent in the past five years, with Statista projecting online food delivery revenue to reach $24 billion by 2023. It was $18 billion in 2019.
Brizo FoodMetrics ran a data drive for QSR to identify the 16 most prevalent aggregator platforms in the U.S. They were:
- DoorDash
- GrubHub
- Postmates
- Uber Eats
- Slice
- MenuPages
- Seamless
- Caviar
- EatStreet
- Delivery.com
- WaitR
- BiteSquad
- Delivery Dudes
- OrangeCrate
- Takeout Central
- Chomp
Across the country, Brizo FoodMetrics found 446,860 establishments using one of those 16 options, including 270,730 independents (four or fewer locations by the company’s definition). Of those, 40.9 percent were deploying one of the 16 apps; 28.9 percent two; 30.2 percent three-plus.
Brizo FoodMetrics also looked at which venues garnered reviews within the last six months and ran through one of those platforms. Of the 202,226 in that pool, the top 20 regional cuisines to emerge were:
- American: 47.9 percent
- Italian: 14.4 percent
- Mexican: 11 percent
- Japanese: 7 percent
- Chinese: 6.8 percent
- Mediterranean: 4.5 percent
- Thai: 3.6 percent
- Greek: 3.2 percent
- Spanish: 2.6 percent
- Indian: 2.2 percent
- Vietnamese: 2.1 percent
- Southern American: 1.8 percent
- Korean: 1.8 percent
- Tex-Mex: 1.7 percent
- Caribbean: 1.7 percent
- Taiwanese: 1.2 percent
- French: 1.2 percent
- Southwestern: 1.1 percent
- Hawaiian: 1 percent
- Creole: 1 percent
And these aggregators had the most “high” ratings:
- DoorDash: 63 percent
- GrubHub: 55 percent
- Postmates: 30 percent
- Uber Eats: 26 percent
- Slice: 11 percent
- MenuPages: 9.5 percent
- Seamless: 3.4 percent
- Caviar: 2.9 percent
- EatStreet: 2.4 percent
- Delivery.com: 1.6 percent
- Waitr: 1.3 percent
- BiteSquad: 1.3 percent
- Delivery Dudes: 0.5 percent
- OrangeCrate: 0.5 percent
- Takeout Central: 0.1 percent
- chomp: 0.03 percent

What’s clear is that an already accelerating movement has become all but universal for restaurants. The lockdown exacerbated convenience; it didn’t surface it. As Datassential notes, “at their core, most problems consumers identified [during COVID-19] weren’t stemming from new needs.”
Although people might be sheltering in place, to say they’re not as busy would be misguided. COVID-19 complicated a lot of families’ work lives—it isn’t as easy to separate home and state. Full-time family care being one example.
Given this change, many creative solutions borne out of the pandemic could serve customers’ needs long-term, Datassential said. COVID-19 tactics have the potential to become evergreen.
From a survey of 1,000 consumers, the company shared some findings into what those lasting changes might look like. And where many diners stand today, as news and progress remains dynamic.
Starting with good news
In the week ending August 16, according to The NPD Group, customer transaction declines at major restaurant chains improved into the single-digits after 21 weeks of double-digit drops. Customer transactions fell 9 percent compared to year-ago levels—a full 35 points better than the steepest plummet of negative 44 percent in the week ending April 12.
Quick-service brands—which represent the bulk of industry transactions—outpaced the pack. They slipped 8 percent, year-over-year. Full-service chains reported declines of 19 percent compared to last year. And as alarming as that this, it’s a 57-point gain from April 12’s crater of negative 76 percent.
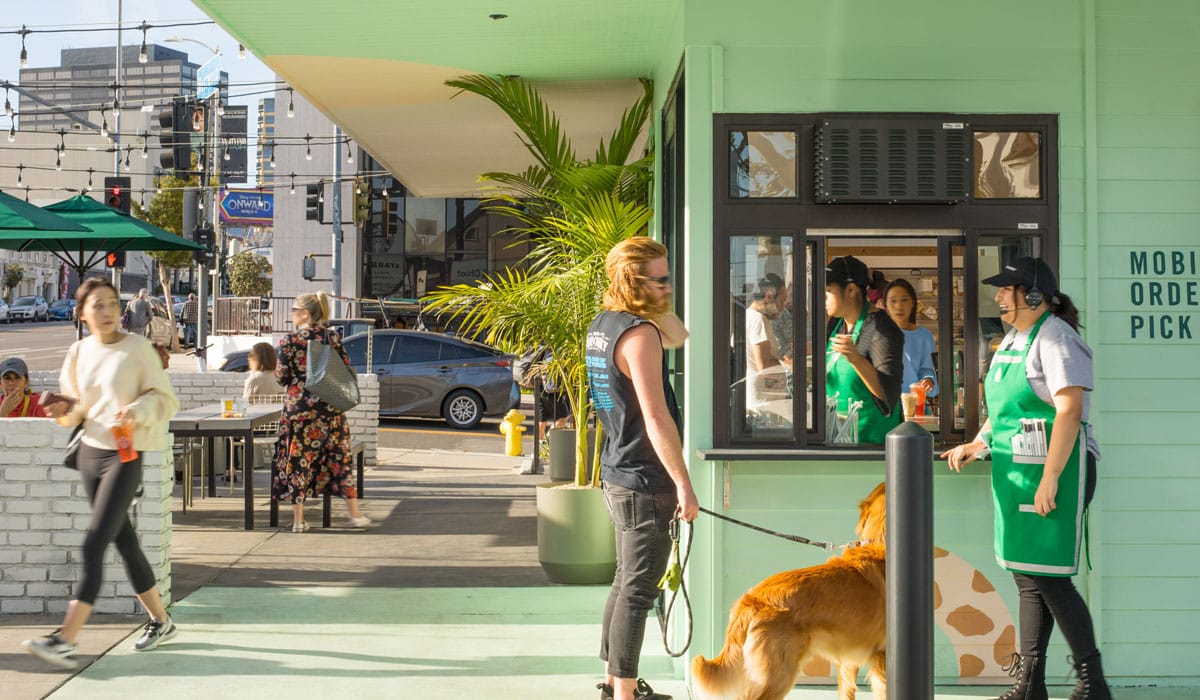
Datassential sees this unfolding on the anecdotal level, too. While off-premises meals remain the majority of business, there’s been a significant uptick across the board as restaurants reopen.
“Have you done any of the following since pandemic restrictions have been in place?
Got restaurant food from a drive-thru
- August 14: 72 percent
- May 19: 59 percent
- Change: 13 percent
Got takeout from a restaurant (went inside the restaurant)
- August 14: 62 percent
- May 19: 46 percent
- Change: 16 percent
Got curbside/walkup takeout (didn’t go inside the restaurant)
- August 14: 57 percent
- May 19: 50 percent
- Change: 7 percent
Got restaurant food for delivery
- August 14: 52 percent
- May 19: 37 percent
- Change: 15 percent
Dined inside at the restaurant itself
- August 14: 41 percent
- May 19: 17 percent
- Change: 23 percent
Got non-alcoholic beverages for delivery
- August 14: 35 percent
Dined outside at the restaurant itself:
- August 14: 34 percent
Got adult beverages for delivery
- August 14: 32 percent
- May 19: 17 percent
- Change: 15 percent
The number that leaps out is “dined inside at the restaurant itself.” You would expect that hike as more venues open up, at more capacity. Outdoor seating proved most popular among Gen Z and millennials, Datassential said.
Concerning regulations and indoor dining plans (or lack thereof), there is plenty of mystery. But what’s evident is people will find restaurants, one way or the other, if they can. It supports the omnichannel strategy countless brands are investing in. There are outlets to deliver food to consumers in a COVID-19 world. It just isn’t as easy to direct them one place or another, making it critical to open up channels. Let the guest pick how they want to access your brand.
Some will rush back into dining rooms. Others might stick to drive thru for months to come. And that might be due to safety concerns, or it might be a byproduct of convenience and customers growing comfortable with new choices (like curbside) that have reigned during coronavirus. A lot of guests that put stock in convenience and leaned on lockdown features, such as apps and contactless ordering and pickup, might never fully go back.
Interest in new tactics raised the bar. Six months into COVID-19, the novelty factor faded to some extent, and competition ramped up. Offering a meal kit isn’t the offbeat, fresh idea it was in early March. As explored in this earlier piece, the drive-thru landscape is about to get a lot more crowded.
“Whether it’s extra work required with kits and take-and bakes, or the possibility for error when mixing your own cocktails, for more than half of consumers, these downsides can limit appeal,” Datassential said.
Price-related concerns are causing some unease. Two-thirds said they see restaurant grocery offerings as too expensive (like selling toilet paper and milk along with sandwiches), and nearly half consider casual takeout meals from fine-dining establishments overpriced.
Like all COVID-19 headlines, this is evolving. People are measuring one option against another, and questioning how price and other value metrics stack up. Previously, convenience and value represented a straightforward tradeoff (pay more for delivery, don’t leave the house). But there are hordes of restaurants offering delivery and takeout in the pandemic arena (to Brizo FoodMetrics’ data), and doing so effectively, efficiently, and with value tied in. The industry is far enough along the COVID-19 journey, and enough dining rooms have reopened, for guests to be more selective.
“Please rate the following statements about new items/services offered due to the pandemic, true or false.”
- I don’t want groceries from restaurants; it’s too expensive: 65 percent
- I don’t want cocktail kits from restaurants; I don’t want to do the work: 62 percent
- I don’t want cocktail kits from restaurants; there is too much room for error: 59 percent
- I don’t want casual takeout meals from upscale restaurants; those are overpriced: 58 percent
- I don’t want meal kits from restaurants; it defeats the purpose if I have to cook it myself: 57 percent
Those above measures were all higher among Boomers at 81, 75, 75, 72, and 74 percent, respectively.
- I don’t want take-and-bake meals; it’s a pain: 53 percent
- I don’t want take-and-bake meals; it defeats the purpose if I have to heat it myself: 52 percent
- I don’t want casual take-out meals from upscale restaurants; they should stick to upscale food: 51 percent
- I don’t like when restaurants do “contactless” menus by making me look online: 43 percent
All of these results don’t necessarily suggest abandoning course. Instead, they prove opportunity remains in execution, from introduction to evolution. It boils down to understanding core customers, and now might be a great time to poll them for feedback. Consumers understand these are strange times. Ask them what’s working and what isn’t, and how the restaurant can improve.
The one-to-one engagement portal has widened. People like being heard and knowing their opinion matters. And compared to the comment cards of old, operators can get a lot more specific than they used to. Zero in on the added revenue streams and channels that matter most, and find out where the gaps are.
Here’s some feedback from customers in Datassential’s study:
“The menus have been very limited. I am trying to support all of our local diners, but they have limited their menus for takeout. I understand the reasons, but it is still annoying.”
Trimming menus in favor of better execution has become a COVID-19 staple, especially when it comes to working with smaller staffs and trying to improve on efficiency points, like speed of service in the drive thru.
As staffing levels rise and some dine-in returns, it might make sense for certain brands to start adding a weekly rotating feature. Something to keep frequent guests engaged and expecting something fresh. Plus, it allows for consistent new news to piggyback other updates, like increased capacity plans or added safety measures. It depends on what defined the concept before.
“Some entrees are overpriced for a takeout meal whose quality is not that great because it doesn’t travel well.”
The value perception is changing.
“I don’t like restaurants that don’t have eco-friendly packaging.”
A topic, perhaps, that doesn’t get talked about enough. For brands pushing sustainability pre-virus, off-premises packaging is a necessary extension to consider.
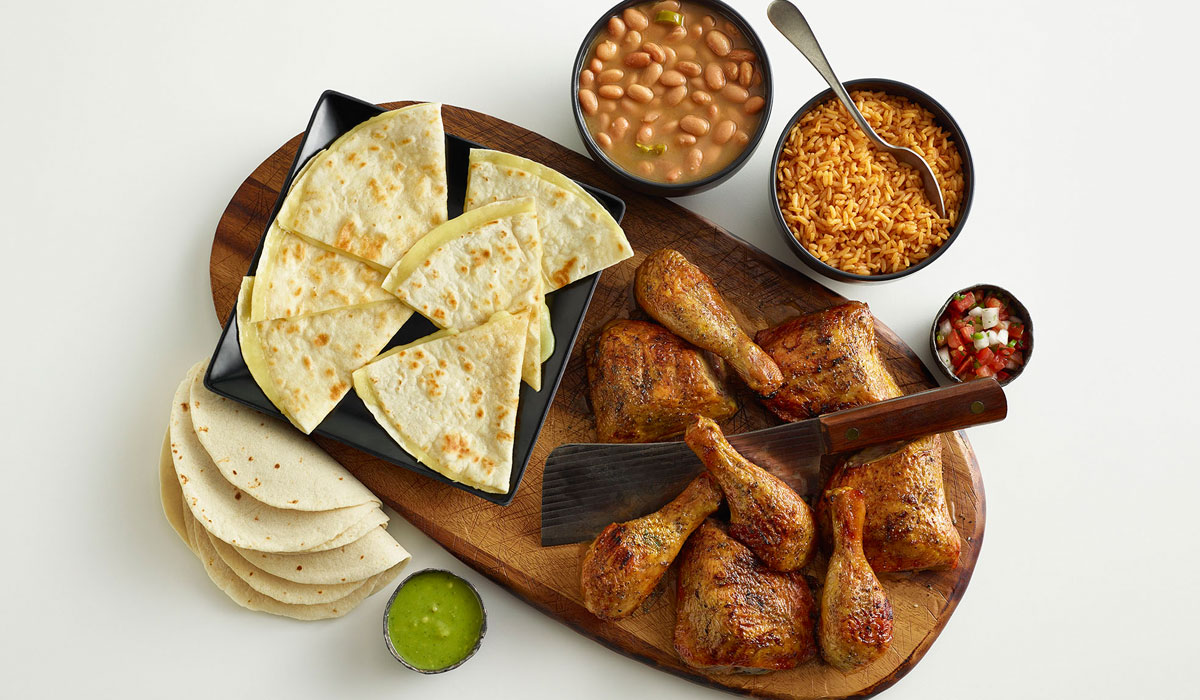
On the family meal topic, Datassential’s study found diners prefer offerings that include “the works.”
They don’t want just one course. Bundles that include everything from entrée to dessert have become even more popular as summer progressed, with close to half of diners opting for a more comprehensive offering.
“Would you want family meal bundles to include …”
- Entrée + appetizer/sides: 38 percent (down 8 percent since May 6)
- Entrée only: 17 percent (down 5 percent since May 6)
- Entrée plus appetizers/sides + dessert: 45 percent (13 percent gain since May 6)
Additionally, family meals are stretching across dayparts. Interest remains strong and continues to grow for bundles that offer customization and large enough portions for multiple meals, Datassential said. And that’s no longer a dinner-dominated point.
Whether it’s the convenience or fatigue from preparing “three squares” a day during lockdown, two-thirds of customers are now interested in family meals for earlier dayparts. This is even more likely among millennials and upper-income households.
“If restaurants offered family meal bundles after they open back up for ‘normal’ dining after COVID, which would you be interested in?”
Extremely/somewhat interested
Family meals with two entrees for choice
- August 14: 78 percent
- May 6: 71 percent
- Change: 7 percent
Family meals with mix-and-match options
- August 14: 78 percent
- May 6: 71 percent
- Change: 7 percent
Family meals: one large entrée and small sides
- August 14: 76 percent
- May 6: 68 percent
- Change: 8 percent
Family size portions of single dishes for multiple meals
- August 14: 76 percent
- May 6: 68 percent
- Change: 8 percent
Multiple individual servings to eat over several days
- August 14: 74 percent
- May 6: 68 percent
- Change: 8 percent
Family meals you can customize for each person
- August 14: 73 percent
- May 6: 67 percent
- Change: 6 percent
Full multi-course meals
- August 14: 72 percent
- May 6: 62 percent
- Change: 10 percent
Family meals for breakfast/brunch
- August 14: 68 percent
- May 6: 52 percent
- Change: 16 percent
Breakfast fatigue appears to finally be setting in. The daypart that’s taken the biggest hit (along with late-night) was the easiest to replace with at-home cooking. And thus, per Datassential’s survey, people are getting tired of cooking it.
Shifting from another early COVID-19 trend, family meals aren’t all about comfort anymore. Preferences are starting to diversify. Healthy and diet-based foods are among the fastest growing bundle choices as consumers start to think about routines again. “New and trendy” options on the rise reflect attrition with the standard go-tos. Pre-virus, variety was a leading dining out factor given a crowded restaurant landscape. You could now argue the off-premises field is becoming saturated itself.
“What would you like to see more of in family-meal options?”
Comfort / classic foods
- August 14: 49 percent
- May 6: 40 percent
- Change: 9 percent
Healthy / better-for-you foods
- August 14: 46 percent
- May 6: 32 percent
- Change: 14 percent (run a highlighter through this one)
Build-your-own foods (tacos, sandwiches, burritos)
- August 14: 43 percent
- May 6: 35 percent
- Change: 8 percent
Indulgent foods that make me feel like I’m treating myself
- August 14: 37 percent
- May 6: 29 percent
- Change: 9 percent
New / interesting / trendy foods and flavors
- August 14: 37 percent
- May 6: 21 percent
- Change: 16 percent (the highest jump)
International / ethnic foods
- August 14: 37 percent
- May 6: 24 percent
- Change: 12 percent
Diet-based foods (Whole 30, paleo, gluten-free, low-carb)
- August 14: 28 percent
- May 6: 14 percent
- Change: 13 percent
Upscale / chef-inspired foods
- August 14: 26 percent
- May 6: 17 percent
- Change: 9 percent
Vegetarian / meatless / plant-based foods
- August 14: 23 percent
- May 6: 13 percent
- Change: 10 percent
Not interested in family meals
- August 14: 13 percent
- May 6: 23 percent
- Change: –10 percent
Everything is climbing except for “not interested in family meals.” It makes the case for turning this phase of menu development into a regular center of innovation.
What’s the holdup? As noted before, value is the biggest barrier to family meals amid COVID-19. Customizability and portion sizes have also made it less appealing for some, Datassential said.
Akin to regular menu ideation, it’s not all about price. Perceived value, when it comes to bundles, can relate to abundance, flexibility, variety, and quality.
“Which issues would discourage you from ordering family meal bundles?”
- Usually too expensive / not a good value: 42 percent (higher with Boomers at 52 percent)
- Usually include items I don’t want / like: 36 percent (where the power of customization comes into play)
- Portions are usually too small: 33 percent
- Usually not offered in the quantity I need: 29 percent
- Others in my household want to choose their own dish: 27 percent (see customization, take it to the next level with digital)
- Too much packaging / not environmentally friendly: 22 percent
- Portions are usually too large: 17 percent
- None of these: 12 percent
Options in the menu
Per Datassential, one in three diners said it was most important to have a mix of different price tiers and the ability to customize, even with limited menus. Fan favorites, comfort foods, and healthful options were “must-haves.” One in four said they want to see new items occasionally rotated in for variety.
“Which are most important to you for restaurants that are only able to offer a limited menu for now?”
Ranked in Top 3
- Offer a mix of different priced options: 35 percent
- Offer some comfort food (classic, traditional) options: 34 percent
- Offer the most popular / fan favorite dishes: 32 percent
- Allow me to customize: 31 percent
- Offer some healthy options: 29 percent
- Occasionally rotate new items in for variety: 28 percent
- Offer new / interesting options: 26 percent
- Offer a mix of smaller (appetizers, sides) and larger dishes (entrées): 24 percent
- Options that travel well for takeout / delivery: 24 percent
- Offer dishes that are hard for me to cook myself at home: 21 percent
- Offer some meatless / vegetarian options: 14 percent
Speaking more on the variety point, here are a look at some foods customers said they were growing tired of eating.
- Pizza: 28 percent
- Sandwiches: 23 percent
- Burgers: 21 percent
- Pasta: 21 percent
- Rice: 18 percent
- French fries: 18 percent
- Mac & Cheese: 17 percent
- Chicken tenders and nuggets: 17 percent
- Potatoes and potato sides: 16 percent
- Tacos: 16 percent
- Fried chicken: 16 percent
- Salad: 14 percent
- Soup: 14 percent
- Beans and legumes: 14 percent
- Salty snacks: 12 percent
- Mexican food: 11 percent
- Barbecue: 10 percent
- Asian food: 10 percent
- Desserts 10
- No: 31 percent

