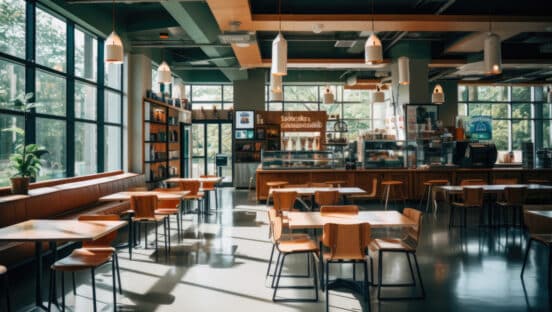
Restaurants have surged to the top of the closure picture, surpassing retail in recent weeks.
As of July 10, according to Yelp’s Q2 Economic Average Report, released Wednesday, there have been 26,160 total restaurant shutterings since the arrival of COVID-19, an increase of 2,179 from June 15. Of those closed, 15,770 permanently shut down, or 60 percent.
The figure accounts for 2,956 additional permanent closures (up 23 percent) from the middle of June. Meanwhile, bars and nightlife—a sector six times smaller than restaurants—endured an even steeper rate, with 5,454 total business closures, 2,429 (44 percent) of which are permanent.
Yelp’s data is not necessarily reflective of the entire industry or exact to a tee. The data is signaled by a business owner marking their business as closed, including changing its hours or through a COVID-19 banner on the Yelp page. Closure counts are an estimate of the businesses most impacted, Yelp said, with many others not counted because they remain open with curtailed hours and staffing, or because they have not yet updated pages to reflect closures.
Additionally, Yelp counts closures vetted by an internal team or updated directly by a business owner. Restaurants can also set automatic reopening dates on Yelp, which are counted as reopenings.
So the reality is, the number is likely even higher on a nationwide scale. In turn, the percentage of restaurants permanently closed is probably lower as part of the full figure.
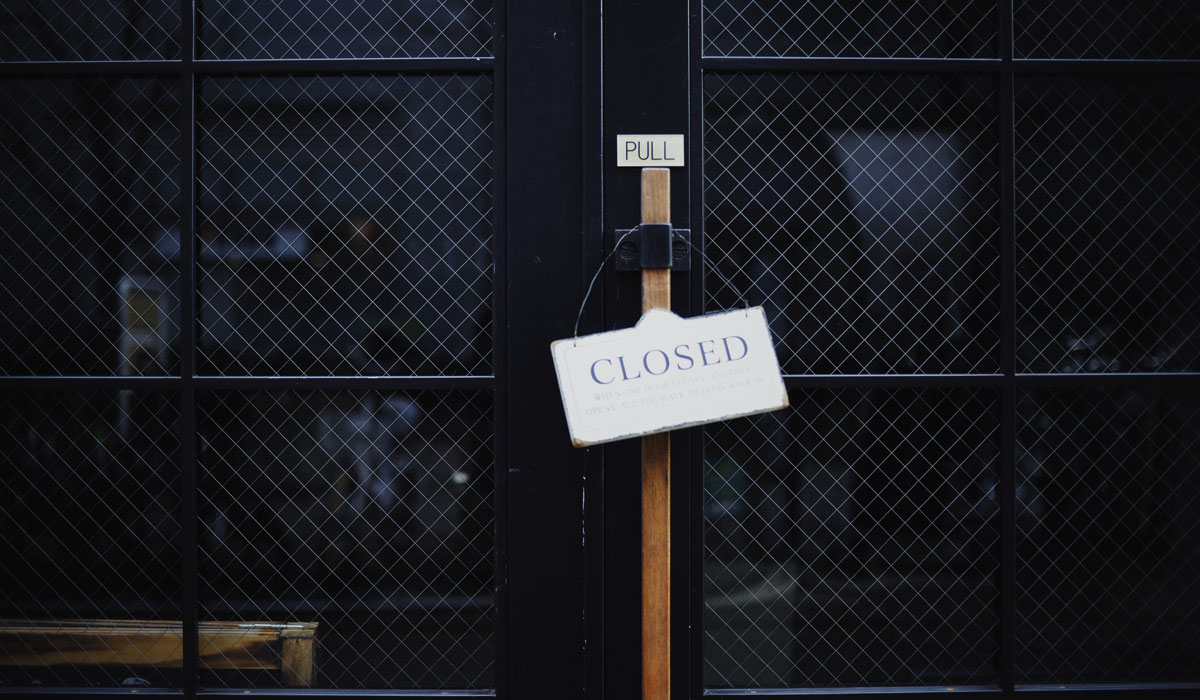
Yet still, Yelp’s data is a sobering window into the current landscape. Close to 16,000 restaurant owners, per this report, have taken the tangible step to tell customers via Yelp they’re shuttered for good.
[image source_ID=”127867″]
There have been a lot of differing points over potential restaurant closures in recent weeks. Mark Siebert, CEO of franchise consulting firm iFranchise Group, said Wednesday in a release, “we will likely see over 100,000 empty shells where restaurants once stood.” He believes the reality will open opportunity for operators to grab prime locations for less, as investment and occupancy costs drop. And it will coincide with an all-time high of displaced restaurant executives, including those will capital to invest, alongside all-time low interest rates. “Once an effective vaccine is found, we anticipate that demand for dining out will quickly return to pre-COVID levels, providing those restaurants that survive a unique opportunity for growth,” he said.
The National Restaurant Association last week noted 100,000 restaurants had closed in the two weeks since COVID-19 restrictions picked up again (temporary making up the vast majority). It’s been reluctant so far to peg a permanent figure, only to say it will be in the “tens of thousands.”
According to The NPD Group’s restaurant census, ReCount, the estimated percentage of restaurants allowed to serve dine-in guests declined from 90 to 82 percent this past week. That aligns closely with the Association’s 100,000 estimate, although it’s unclear how many restaurants pivoted back to off-premises or just decided to pause altogether.
Financial services company Rabobank projected 50,000–60,000 eventual permanent closures in the independent restaurant sector alone, or 15–20 percent of the entire group. That prediction would erase 8–10 percent of restaurants in the next 12 months.
To understand the dire independent outlook, the average restaurant (industrywide) appreciates annual revenue of $1 million and operating profit of just 4–5 percent. A 2016 study from JPMorgan Chase showed that restaurants report some of the lowest average cash reserves among small businesses, with only enough on hand to cover 16 days.
That was less than repair and maintenance (18), retailers (19), construction (20), and personal services (21).
Michael S. Kaufman, a senior lecturer of business administration at Harvard’s Business School, wrote in a recent article that restaurants, on average, spend 30 percent of their revenue on labor. They spend roughly the same for cost of goods sold. Independents, however, typically purchase without the ability to hedge or otherwise lock in price. They’re at the mercy of supply-price fluctuations, and thus, face a rather challenging battle in the close-reopen-close-reopen dynamic.
For countless small restaurants, they had only two to three weeks of operating reserves at the onset of COVID-19. This makes pivoting and paying for labor (new and recalled), inventory, back rent, and all the updated protocols, like PPE and plastic partitions, a near impossibility for some.
Consumer trends, demand, more uncertainty
There are a lot of angles to the data. “Eating and drinking places” registered sales of $47.4 billion on a seasonally adjusted basis in June, according to preliminary figures from the U.S. Census Bureau as reported by the Association. It marked the second consecutive monthly sales gain after April registered a low of $30 billion.
June actually showed the highest volume since the beginning of lockdowns in March, but still $18 billion below pre-COVID-19 numbers in January and February.
While this speaks a positive undertone, seasonally adjusted figures don’t quite provide a complete picture of sales losses, the Association said. Rather they offer a directional look at spending trends from month to month.
A better measure might be the Census Bureau’s unadjusted data set, since it represents actual dollars coming in the door.
In total, between March and June, eating and drinking place sales declined more than $116 billion from expected levels, the Association said. Add in the sharp reduction in spending at non-restaurant foodservice operations in the other sectors, like retail and lodging, and the total shortfall in restaurant and foodservice sales likely surpassed $145 billion during the last four months.
The big question today, though, might just circle consumer demand and how case spikes are affecting (or not affecting) purchasing.
Yelp said Wednesday interest has continued to shift since May, but less rapidly than March in April. Interest for alcohol-related experienced increased since June 1 relative to other food activities, with a rise for wineries (51 percent), cideries (39 percent), breweries (24 percent), and distilleries (19 percent). Meanwhile, grocery-related businesses witnessed a slide in their ultra-high, early demand as people elect to spend less time at home. Beer, wine, and spirit stores have fallen 21 percent.
This is something financial services company Rabobank provided data on as well. It believes there’s evidence of foodservice recovery thanks to the absence of a consumer shift to at-home food during case upticks, unlike the massive turn to food retail during the initial surge in March and April. Food retail spending is up only mid- to high-single digits compared to January, which is mostly in line with spending patterns in mid-June and well below the 20–30 percent increase in March and April.
The top five markets with the sharpest increase in COVID-19 cases in the last two weeks—Florida, Texas, California, Arizona, and Georgia—are reporting only modest declines in foodservice spending from pre-surge levels, Rabobank said. It ranges from negative 1 percent in Arizona to negative 6 percent in Texas, and this as daily positive cases more than doubled in California, Arizona, Georgia, and more than tripled in Florida and Texas.

At the same time, spending continues to recover or remains intact in prior high-case areas, like New York, or in states with relatively low infection rates.

What this suggests, Rabobank said, is that restaurants are holding recent gains amid rises in COVID-19 cases. Where the decline is taking place is from transaction losses tied to dine-in business pulled back by mandates. It’s not reflective of consumers choosing to dine out less, necessarily.
In California, for instance, where indoor dining was suspended July 13, full-service restaurant transactions decreased 6 points to negative 51 percent versus year-ago levels (week ending July 12), NPD reported—the lowest percentage of any state.
But for the entire country, total customer transactions dipped 14 percent compared to 2019, only a 3-point deceleration from the previous week. Quick-service restaurant chains fell back 4 points to negative 13 percent, while full service upped 3 points to negative 26 percent.
It remains well above previous sector lows of negative 40 and 80 percent, respectively.
The recent hike in COVID-19 cases has paused, but not reversed, the broad-based improvement in consumer spending, Rabobank said. It improved from a peak decline of negative 33 percent in late March (relative to average spending in January) to negative 9 percent in early July. During this same period, foodservice and accommodation spending rebounded from negative 67 percent at the onset of the national shutdown to negative 37 percent in early July.
Another takeaway: Given daily COVID-19 cases have more than doubled, you can look at new hotspot markets differently than early ones. And it’s potentially predictive of what’s still to come.
These states, like Florida, Texas, and Nevada, are dealing with coronavirus on a delay of sorts. With that, consumers and operators have had time to prepare for a “new normal” and restaurants can better capture revenue through available channels. Consumers themselves are more prepared and willing, from their own safety protocols to the availability of masks.
These hotspot states are home to rising closures in recent weeks. Most states have seen a plateau of temporary closures, Yelp said, while Arizona, Texas, and Florida have started to report a recent increase again. Across all industries (not just restaurants), California, Texas, and New York have the highest total number of closures (29,351, 11,118, and 8,731, total closed businesses, respectively).

On a metro level, Las Vegas is suffering from the highest rate of permanently closed business with 861 as it takes a hit in tourism dollars. LA has the most closures overall at 11,342 temporary and permanent.
In April, Yelp reported more than 175,000 business closures, which indicates only 24 percent of businesses that were closed have reopened overall.
Even as total closures fall, permanent shutterings increased with 72,842 out of the 132,580 total closed businesses, a lift of 15,742 permanent closures since June 15. This also means that the percentage of permanent to temporary business closures is rising, Yelp said, with permanent closures now accounting for 55 percent of all closed businesses since March 1, an increase of 14 percent from June when Yelp reported 41 percent of closures as permanent.


Considering the future
There is a question, however, around whether consumers dining out at restaurants is resulting in more COVID-19 cases. The same is true of other industries that reopened, like gyms, etc.
In states with at least three total cases per 1,000 population, the 10 areas with the largest increase in COVID-19 cases in June all saw a significant increase (50 percent-plus) in consumer interest in restaurants, bars and nightlife, and gyms in May, relative to the shutdown level of activity in late March and early April, Yelp said.
In the 10 states with the largest decrease in COVID-19 cases in June, including Massachusetts, New York, and Connecticut, consumer interest in the same activities remained flatter in May, increasing less than 50 percent relative to the shutdown in all 10 states. As outbreaks worsened through late June, consumer interest in these categories started to come back down in states like Florida, Texas, South Carolina, and Arizona.
Yelp said this emphasizes the correlation between the pandemic and consumer behavior. When there’s a major outbreak, consumer interest tails to an extent. When cases are flat, consumer demand snaps back quickly to pre-pandemic norms.
The near-term reality could be uneven recovery with a good deal of closures. But with current hotspot states (for businesses remaining open) dealing with the drop-off better than early ones did.
Outset centers, like New York, New Jersey, Connecticut, Massachusetts, and Pennsylvania, have witnessed daily cases decline from a peak of nearly 19,000 in early April to 1,900 in the last seven days. Hospitalization and mortality rates have declined, too, Rabobank said, “paving the way for further easing of restrictions on non-essential businesses, including foodservice.”
The point being that rising cases and reopened businesses should be viewed as an evolving target. How states respond to spikes has changed and continues to change. The same is true of customer demand.
Although, it’s still difficult to gauge any sort of blanket impact. There’s likely to be more divergence in trends coming pre-COVID-19, like convenience and, now, contactless. And those concepts ready to pivot with the means, capital, and desire to do so, versus those that don’t have the funds to endure until dine-in returns in full. Or simply concepts not built to thrive outside the four walls.
In the restaurant sector, Yelp said there’s been a jump in consumer interest over the past two months for German cuisine, live and raw food, French food, and steakhouses. Relative to other categories, they’re up 35, 36, 21, and 20 percent, respectively.
As people head back into restaurants, fast casual and common delivery foods continue to decline at a slow rate, including fast food (down 19 percent), cheesesteaks (down 8 percent), chicken wings (down 15 percent), and pizza (a drop of 7 percent).