


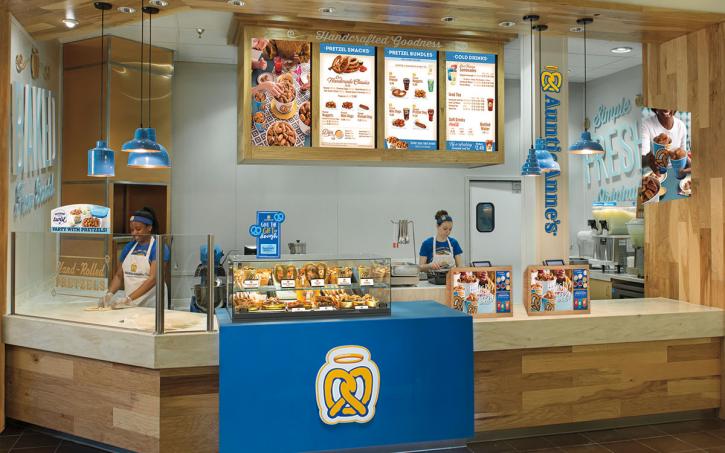


Dunn Brothers Coffee is putting a jolt into this weekend, as it calls on cold brew lovers to rejoice. The neighborhood coffee shop famed for freshly roasting its globally sourced single-origin green beans daily onsite is celebrating National Cold Brew Day, April 20, 2024, with a weekend full of bold, smooth flavor-packed fun! For two […]


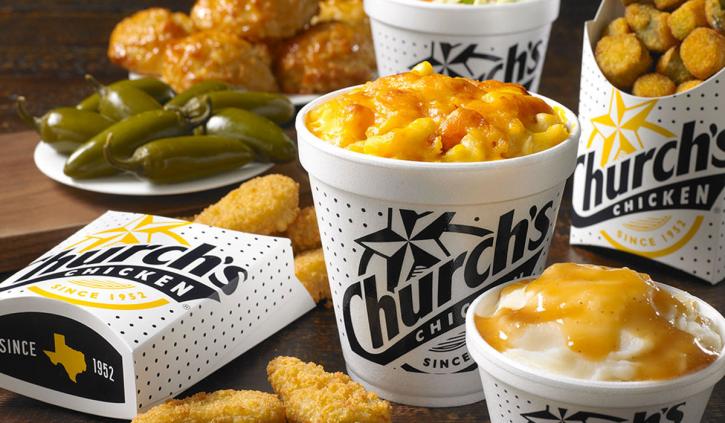
Checkers and Rally’s, the double drive-thru burger and fries’ brand, just opened its newest restaurant in Arizona located at 12239 W Thunderbird Rd. The El Mirage restaurant is co-owned by Keith Gallagher and his business partner, bringing a mouthwatering dining experience to the local community. Gallagher is a distinguished business leader with a diverse background […]
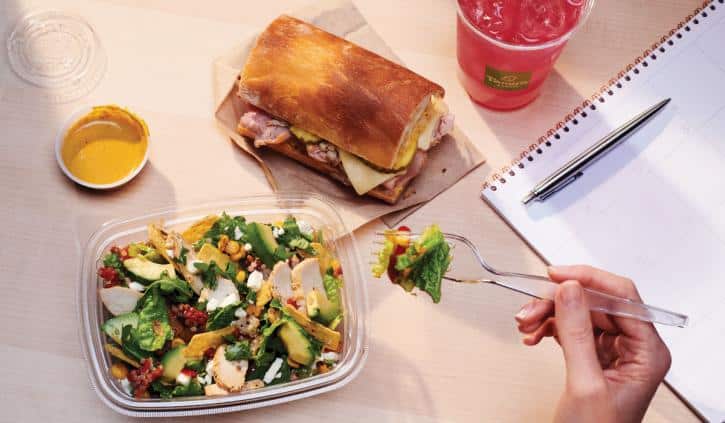
On April 21st, The Coffee Bean & Tea Leaf is offering buy one get one 50% off on all teas. What’s more, is that The Coffee Bean Rewards app has undergone a complete makeover to provide customers with an upgraded rewards program that offers more perks. As part of this program, members can enjoy unlocking rewards like […]
Subscribe to A.M. Jolt
"*" indicates required fields