


Fast food for a new world
COVID-19 has accelerated the fast-food industry years in a matter of months. Marketing. Digital. Loyalty. Menu simplification. Expansion and retraction. It’s safe to assume the sector that emerges on the other side will look materially different.
Every year, the QSR 50 provides a status update by examining key metrics—sales, average-unit volume, and unit count. This year’s edition serves more as a baseline for the future given how rapidly everything has changed. Who was growing pre-pandemic? Who has the potential to surge once the dust settles? Who will continue shrinking in the coming year and beyond?
CHECK OUT PAST RESULTS:
Before the COVID-19 hammer dropped, here’s a look at where the country’s biggest restaurants stacked up, and how it compares to the previous calendar.
Note: The unit counts are by U.S. restaurants as of 2019 year end.
1. Subway
Unit count: 23,802
Franchised stores: 23,802
Company stores: 0
Total change in units from 2018: –996
U.S. systemwide sales (millions): $10,000
Average sales per unit (thousands): $410
2. Starbucks
Unit count: 15,041
Franchised stores: 6,768
Company stores: 8,273
Total change in units from 2018: 216
U.S. systemwide sales (millions): $21,550
Average sales per unit (thousands): $1,454
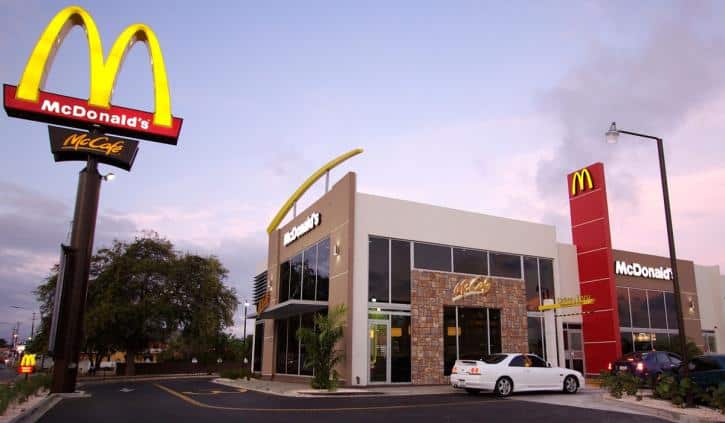
3. McDonald’s
Unit count: 13,846
Franchised stores: 13,154
Company stores: 692
Total change in units from 2018: –66
U.S. systemwide sales (millions): $40,413
Average sales per unit (thousands): $2,912
4. Dunkin’
Unit count: 9,630
Franchised stores: 9,630
Company stores: 0
Total change in units from 2018: 42
U.S. systemwide sales (millions): $9,220
Average sales per unit (thousands): $968
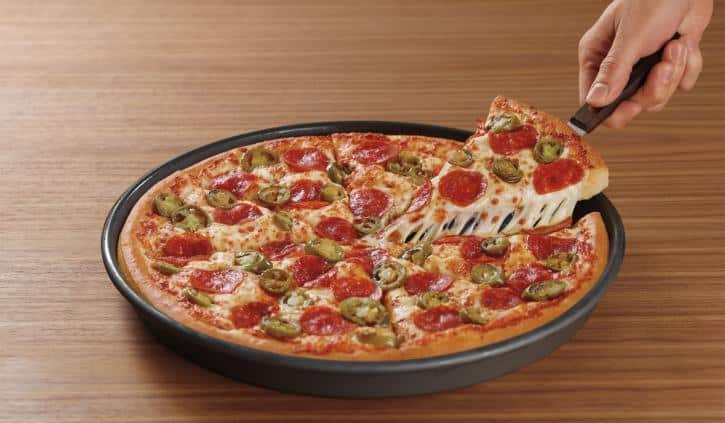
5. Pizza Hut
Unit count: 7,416
Franchised stores: 7,393
Company stores: 23
Total change in units from 2018: –40
U.S. systemwide sales (millions): $5,380
Average sales per unit (thousands): $714
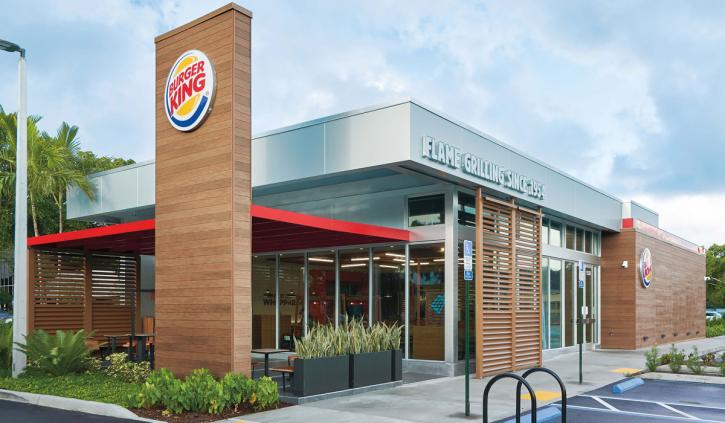
6. Burger King
Unit count: 7,346
Franchised stores: 7,294
Company stores: 52
Total change in units from 2018: 16
U.S. systemwide sales (millions): $10,300
Average sales per unit (thousands): $1,399
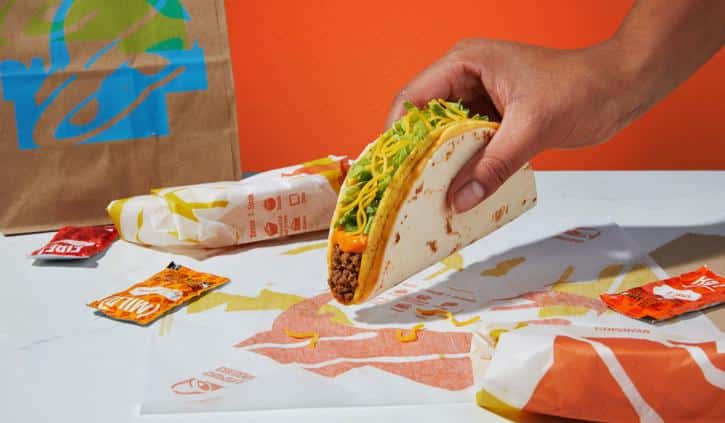
7. Taco Bell
Unit count: 7,089
Franchised stores: 6,622
Company stores: 467
Total change in units from 2018: 181
U.S. systemwide sales (millions): $11,000
Average sales per unit (thousands): $1,502
8. Domino’s
Unit count: 6,157
Franchised stores: 5,815
Company stores: 342
Total change in units from 2018: 253
U.S. systemwide sales (millions): $7,100
Average sales per unit (thousands): $1,178
9. Wendy’s
Unit count: 5,852
Franchised stores: 5,495
Company stores: 357
Total change in units from 2018: 30
U.S. systemwide sales (millions): $9,865
Average sales per unit (thousands): $1,666
10. Dairy Queen
Unit count: 4,381
Franchised stores: 4,379
Company stores: 2
Total change in units from 2018: –25
U.S. systemwide sales (millions): $3,760
Average sales per unit (thousands): $713
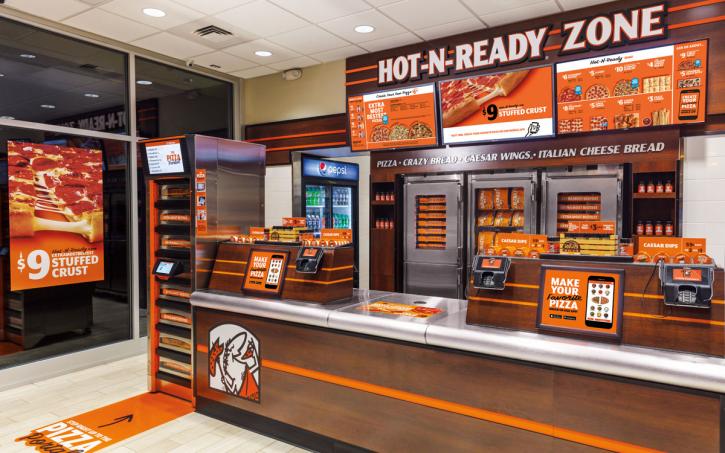
11. Little Caesars
Unit count: 4,213
Franchised stores: 3,652
Company stores: 561
Total change in units from 2018: –49
U.S. systemwide sales (millions): $3,850
Average sales per unit (thousands): $899
12. KFC
Unit count: 4,065
Franchised stores: 4,009
Company stores: 56
Total change in units from 2018: –9
U.S. systemwide sales (millions): $4,820
Average sales per unit (thousands): $1,196
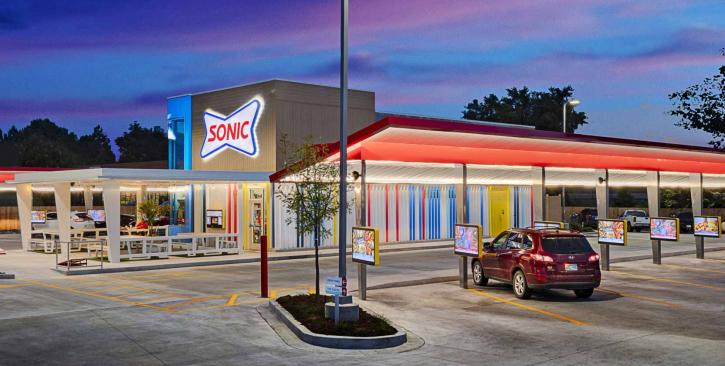
13. Sonic Drive-In
Unit count: 3,526
Franchised stores: 3,329
Company stores: 197
Total change in units from 2018: –74
U.S. systemwide sales (millions): $4,687
Average sales per unit (thousands): $1,320
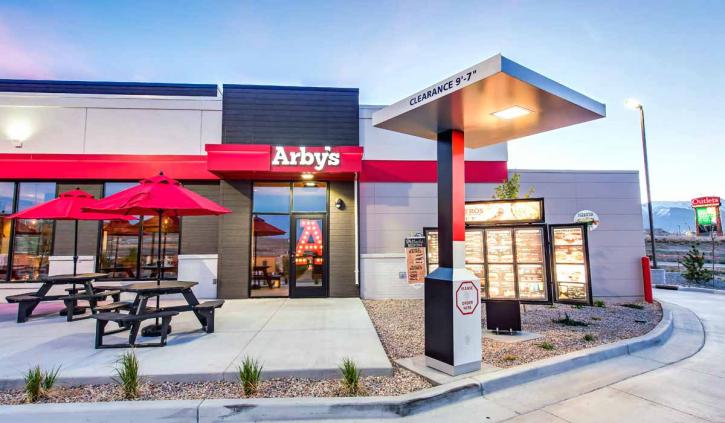
14. Arby’s
Unit count: 3,359
Franchised stores: 2,170
Company stores: 1,189
Total change in units from 2018: 30
U.S. systemwide sales (millions): $3,885
Average sales per unit (thousands): $1,183
15. Papa John’s
Unit count: 3,142
Franchised stores: 2,544
Company stores: 598
Total change in units from 2018: –57
U.S. systemwide sales (millions): $2,655
Average sales per unit (thousands): $837
16. Jimmy John’s
Unit count: 2,787
Franchised stores: 2,735
Company stores: 52
Total change in units from 2018: –13
U.S. systemwide sales (millions): $2,105
Average sales per unit (thousands): $759
17. Chipotle
Unit count: 2,580
Franchised stores: 0
Company stores: 2,580
Total change in units from 2018: 130
U.S. systemwide sales (millions): $5,520
Average sales per unit (thousands): $2,195
18. Baskin-Robbins
Unit count: 2,524
Franchised stores: 2,524
Company stores: 0
Total change in units from 2018: –26
U.S. systemwide sales (millions): $626
Average sales per unit (thousands): $247
19. Chick-fil-A
Unit count: 2,500
Franchised stores: 2,500
Company stores: 0
Total change in units from 2018: 130
U.S. systemwide sales (millions): $11,000
Average sales per unit (thousands): $4,517
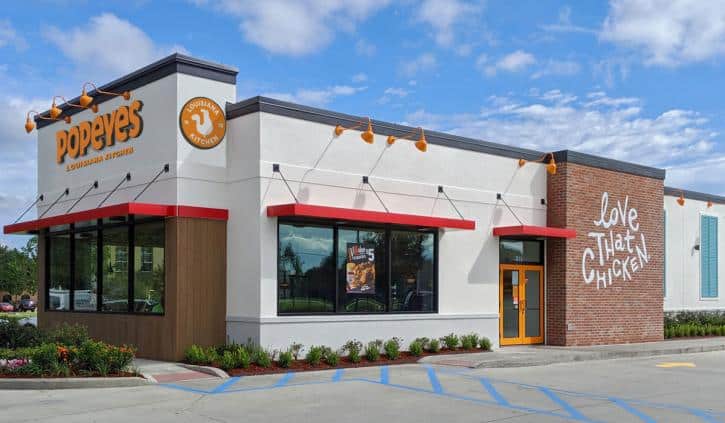
20. Popeyes Louisiana Kitchen
Unit count: 2,499
Franchised stores: 2,458
Company stores: 41
Total change in units from 2018: 131
U.S. systemwide sales (millions): $3,750
Average sales per unit (thousands): $1,541
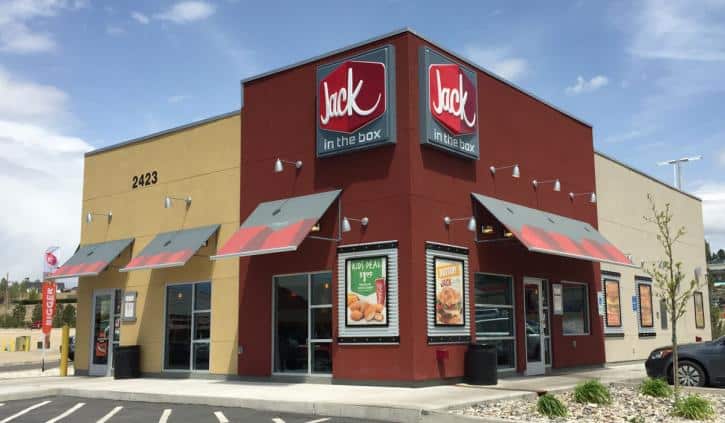
21. Jack in the Box
Unit count: 2,243
Franchised stores: 2,106
Company stores: 137
Total change in units from 2018: 6
U.S. systemwide sales (millions): $3,505
Average sales per unit (thousands): $1,565
22. Panera Bread
Unit count: 2,225
Franchised stores: 1,202
Company stores: 1,023
Total change in units from 2018: 132
U.S. systemwide sales (millions): $5,925
Average sales per unit (thousands): $2,751
23. Panda Express
Unit count: 2,184
Franchised stores: 138
Company stores: 2,046
Total change in units from 2018: 80
U.S. systemwide sales (millions): $3,800
Average sales per unit (thousands): $1,765
24. Hardee’s
Unit count: 1,830
Franchised stores: 1,713
Company stores: 117
Total change in units from 2018: –16
U.S. systemwide sales (millions): $2,070
Average sales per unit (thousands): $1,126
25. Jersey Mike’s
Unit count: 1,667
Franchised stores: 1,595
Company stores: 72
Total change in units from 2018: 173
U.S. systemwide sales (millions): $1,340
Average sales per unit (thousands): $824
26. Papa Murphy’s
Unit count: 1,368
Franchised stores: 1,301
Company stores: 67
Total change in units from 2018: –69
U.S. systemwide sales (millions): $748
Average sales per unit (thousands): $551
27. Five Guys
Unit count: 1,368
Franchised stores: 872
Company stores: 496
Total change in units from 2018: 10
U.S. systemwide sales (millions): $1,662
Average sales per unit (thousands): $1,359
28. Wingstop
Unit count: 1,231
Franchised stores: 1,200
Company stores: 31
Total change in units from 2018: 107
U.S. systemwide sales (millions): $1,400
Average sales per unit (thousands): $1,250
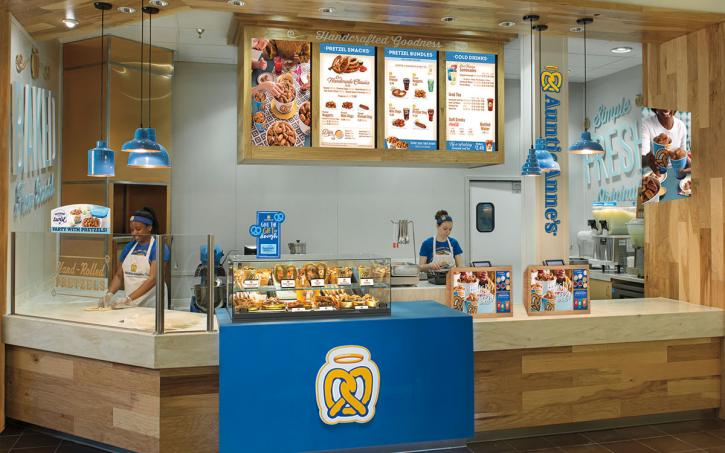
29. Auntie Anne’s
Unit count: 1,211
Franchised stores: 1,200
Company stores: 11
Total change in units from 2018: –20
U.S. systemwide sales (millions): $563
Average sales per unit (thousands): $562
30. Firehouse Subs
Unit count: 1,153
Franchised stores: 1,115
Company stores: 38
Total change in units from 2018: 24
U.S. systemwide sales (millions): $855
Average sales per unit (thousands): $729
31. Carl’s Jr.
Unit count: 1,100
Franchised stores: 1,052
Company stores: 48
Total change in units from 2018: –21
U.S. systemwide sales (millions): $1,390
Average sales per unit (thousands): $1,252
32. Church’s Chicken
Unit count: 1,050
Franchised stores: 885
Company stores: 165
Total change in units from 2018: –35
U.S. systemwide sales (millions): $700
Average sales per unit (thousands): $688
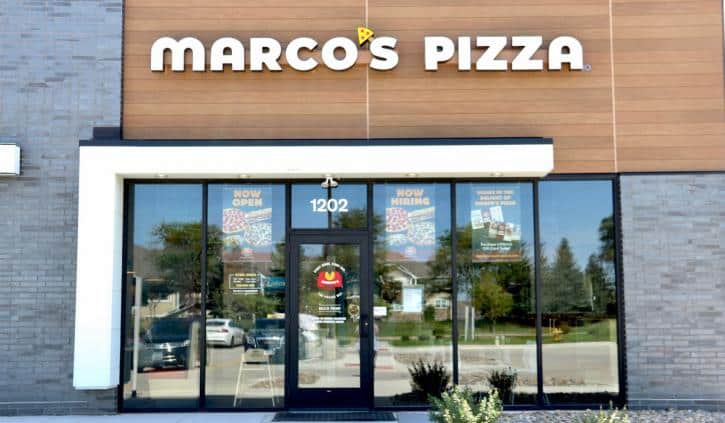
33. Marco’s Pizza
Unit count: 915
Franchised stores: 875
Company stores: 40
Total change in units from 2018: 32
U.S. systemwide sales (millions): $628
Average sales per unit (thousands): $726
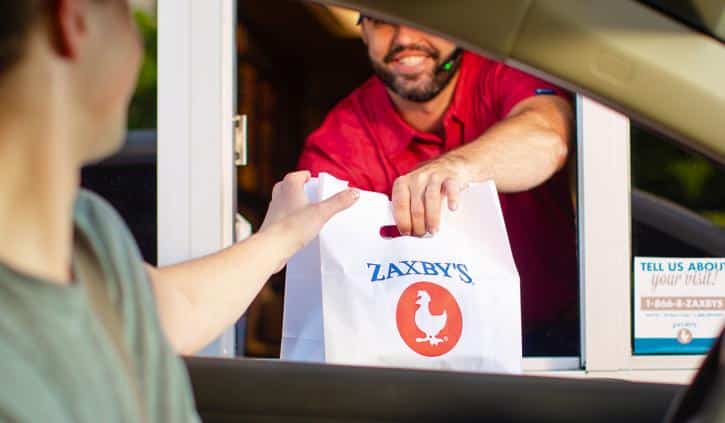
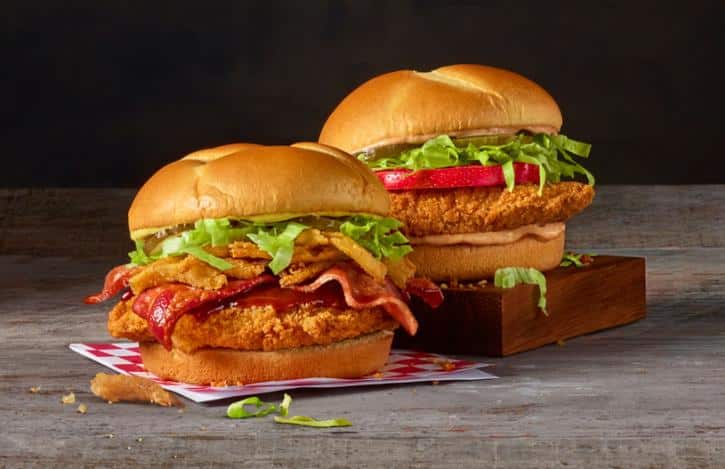
34. Zaxby’s
Unit count: 904
Franchised stores: 755
Company stores: 149
Total change in units from 2018: 6
U.S. systemwide sales (millions): $1,840
Average sales per unit (thousands): $2,030
35. Checkers/Rally’s
Unit count: 890
Franchised stores: 634
Company stores: 256
Total change in units from 2018: 4
U.S. systemwide sales (millions): $862
Average sales per unit (thousands): $1,087
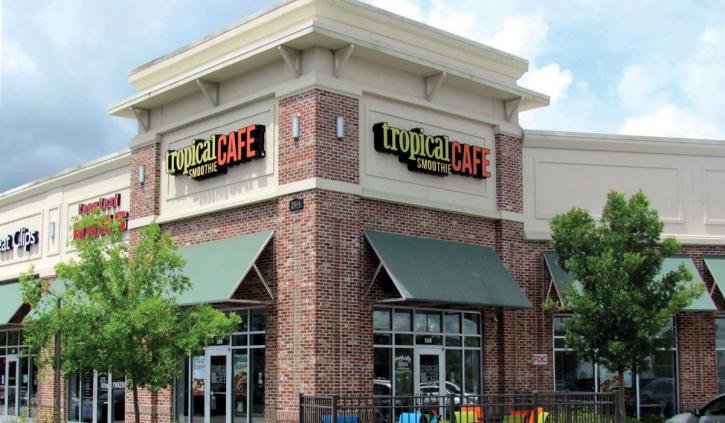
36. Tropical Smoothie Café
Unit count: 834
Franchised stores: 833
Company stores: 1
Total change in units from 2018: 115
U.S. systemwide sales (millions): $577
Average sales per unit (thousands): $769
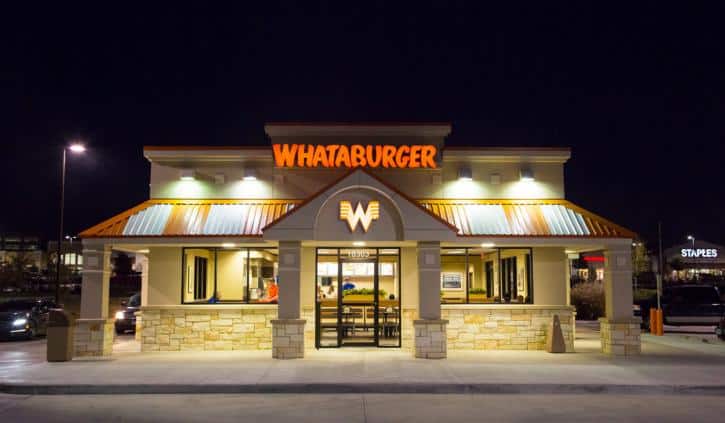
37. Whataburger
Unit count: 830
Franchised stores: 127
Company stores: 703
Total change in units from 2018: 5
U.S. systemwide sales (millions): $2,556
Average sales per unit (thousands): $3,080


