


Wienerschnitzel, the world’s largest hot dog concept, announced today a new addition to its executive leadership team, Doug Koob. In this new role, Koob will oversee sales and business development teams for both domestic and international growth, real estate, along with restaurant design and construction. Koob’s background of 40-plus years in the hospitality industry led […]
Abbott’s Frozen Custard, the oldest frozen custard franchise in the nation, is celebrating the grand opening of its first franchise location in the state of Texas. Located in the Dallas suburb of McKinney, at 1520 N Hardin Boulevard, it is the first of more than 100 locations throughout Texas to be opened by owner-operator Southern […]

Wendy’s on Tuesday shared progress in sourcing renewable energy through its participation in community solar programs. Emissions reductions from these programs will advance progress against Wendy’s science-based targets to reduce absolute Scope 1 and 2 emissions by 47 percent, and Scope 3 emissions from franchisees by 47 percent per restaurant by 2030, both from a […]
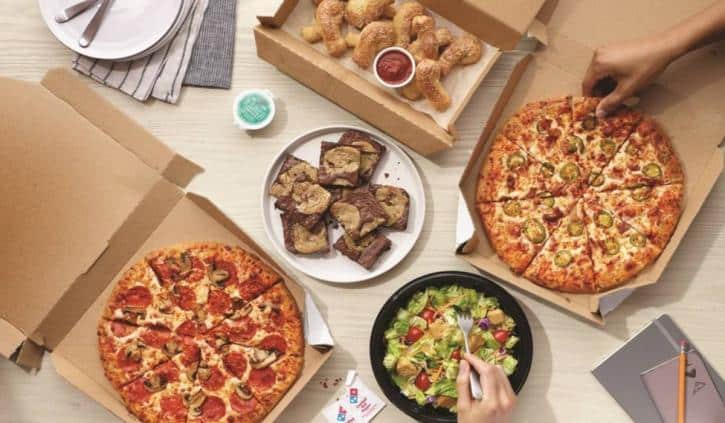
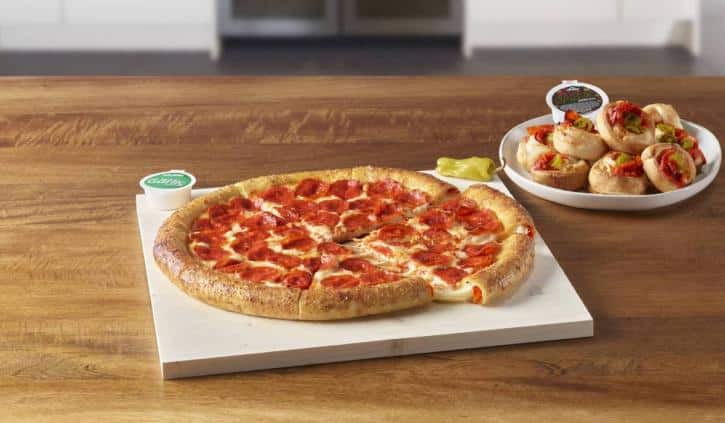
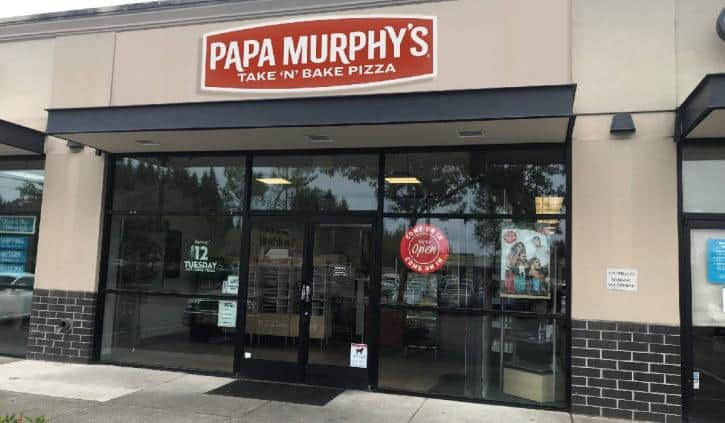
Why choose between your two loves when you can have both? Papa Murphy’s Take ‘n’ Bake Pizza—the take ‘n’ bake pizza franchise with over 1,135 locations around the globe—announced the return of the crowd-favorite Taco Grande Pizza, a culinary fusion available at participating locations nationwide from April 22 to May 19. This season’s must-try pizza […]
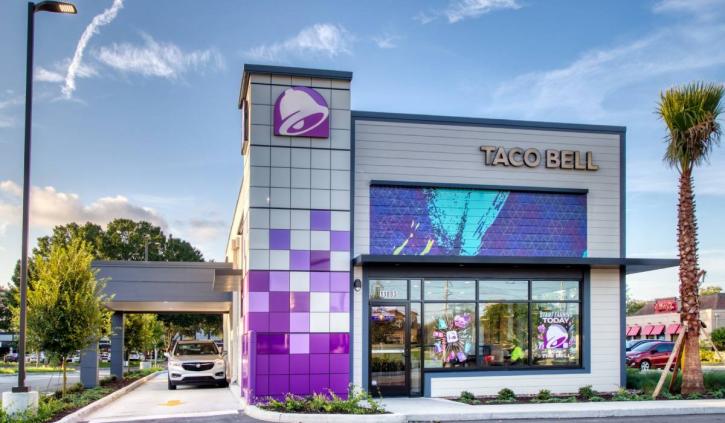
On Monday, Taco Bell is announcing the expansion of their popular recycling program with TerraCycle to also collect and recycle any brand of sauce dipping cups, souffle cups/lids & coffee creamer pods. To make it official, the program has been renamed the Taco Bell Sauce Container US Recycling Program. “Taco Bell’s category-wide recycling program, along […]
Ben’s Soft Pretzels, the beloved purveyor of warm, doughy delights, is gearing up for a pretzel-filled celebration on National Pretzel Day, which falls on April 26th. As pretzel enthusiasts across the nation mark their calendars, Ben’s Soft Pretzels is rolling out an irresistible offer that combines philanthropy with indulgence. The Deal: Donate and Delight On April 26th, visit […]
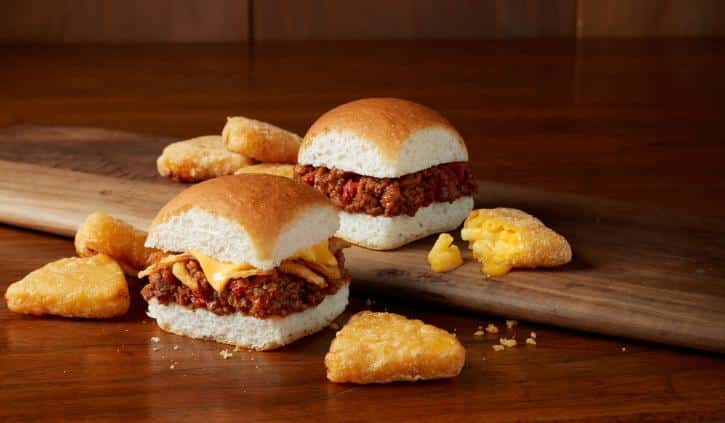
Krystal Restaurants LLC, the original quick-service restaurant chain in the South known for its iconic square sliders, is making it Krystal clear that value is available around the clock. Starting April 22 for a limited time, guests can enjoy the Krystal Meal Deal for $4.99, the 2 for $4.99 breakfast deal and the new Krystal […]

Subscribe to A.M. Jolt
"*" indicates required fields