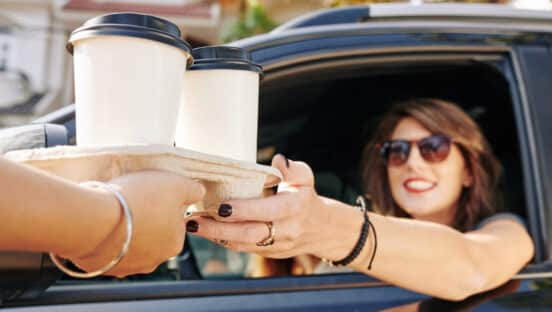
This year’s QSR Drive-Thru Study returned some interesting results. Perhaps chief among them, speed of service. You could definitely make the argument that speed isn’t the king it once was in drive thru. Quality, accuracy, and service are all part of this complex conversation, especially as mobile orders and delivery kick up. But, at the end of the day, a very large swath of consumers are headed to the lane in order to save time, not waste it. It all just comes down to how you measure it. What was the customer journey like, from order board to payment to window? No matter what additional methods enter the marketplace, the drive thru will remain an essential part of the fast-food landscape. And time from pull up to exit will continue to be a buzzing indicator.
Based on seconds, here are the fastest and slowest brands surveyed in this year’s study, plus a look back at how they’ve fared over the years.
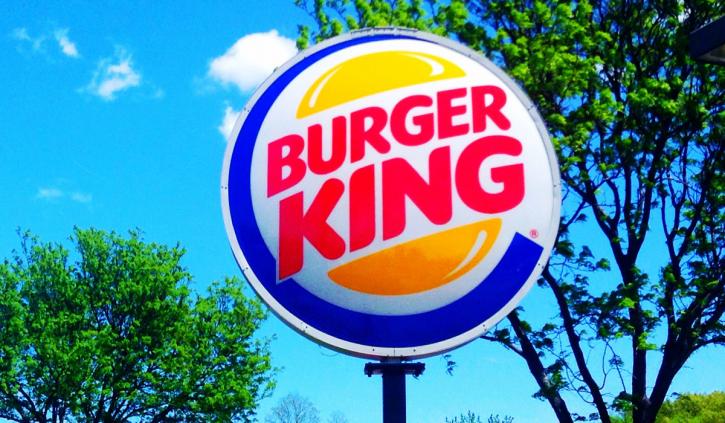
1. Burger King
Average time in seconds: 193.31
2017: 189.48 (fourth place overall)
2016: 201.18 (third place)
As you can see from the above metric, Burger King’s spot atop the list reflects an overall trend for the industry. Simply, average overall speed is on the downswing. Of the brands studied this year, the average was 234.08 seconds. That’s a significant drop from last year’s 224.77 mark. It was 226.30 the previous year. The difference between 2017 and 2016 was relatively negligible, but this year’s decline is definitely worth considering. Back in 2003, the year Wendy’s scored an all-time Drive-Thru Study best of 116 seconds, the national average was about 190 seconds.
As noted earlier, this drop is being countered by other improvements. Order accuracy has improved over time, and this year’s 89.7 percent measurement is just a hair above last year’s 89.4 percent. Technology is helping restaurants improve customer experience and evolve the conversation. Tablets have allowed for efficient line-busting; wireless communications systems have made back-and-forth with the customer more effortless; and LED menuboards have given guests clearer ideas of what they might want to order. Some of the interaction (think Chick-fil-A’s staff outside in the drive-thru line), improve customer service but can be a drag on speed of service. Is that trade-off worth it for today’s customer? If the chicken leader’s performance is any indication (100 percent favorable exterior appearance and more on that later), it sure seems to be.
Check out the entire Drive-Thru Study here.
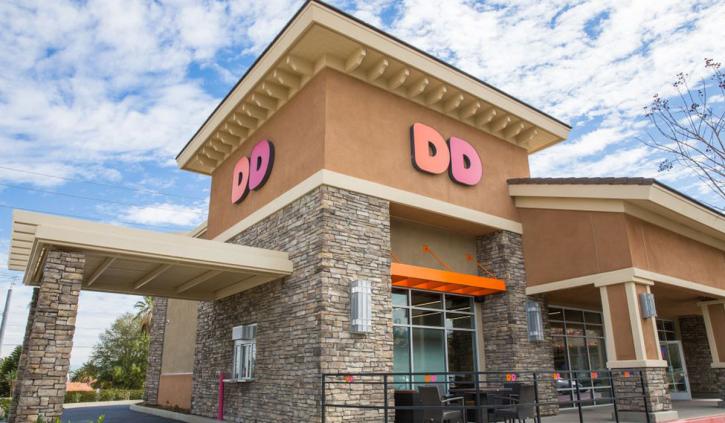
2. Dunkin’
Average time in seconds: 200.74
2017: 173.85 (second place overall)
2016: 181.03 (second place)
Dunkin’s run of second-place results continues. That could change next year as Dunkin’s NextGen prototypes hit the market. Some models include a mobile-order-only lane in the drive thru. This will be an alluring outlet for guests to sign up for Dunkin’s Rewards program, and another way to keep plugged-in loyalists coming back. Dunkin’ expects to have 50 of these new units open by year’s end. Here’s a deeper look into some of the changes taking place at the beverage leader.
Here’s how Dunkin’ stacks up in some other key categories:
Order accuracy: 89.6 percent (seventh)
Eye contact: 90.6 percent (third)
Saying please: 38.8 percent (ninth)
Pleasant demeanor: 83.1 percent (fifth)
Smile: 75 percent (sixth)
Saying thank you: 86.3 percent (last)
Check out the entire Drive-Thru Study here.
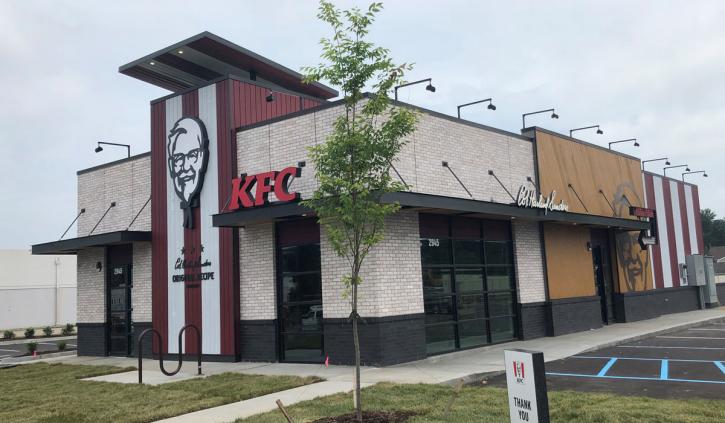
3. KFC
Average time in seconds: 218.95
2017: 230.98 (eighth place overall)
2016: 203.91 (fourth place)
KFC’s speed of service got a bit off track last year, but the chicken giant is back among the leaders. One area the brand lost some steam on, however, was order accuracy. KFC’s 69.9 percent result was last among this year’s chains by a sizable margin (Carl’s Jr. was next at 87.7 percent). That was a significant fall-off from 2017’s 83.20 percent accuracy and 2016’s 88.6 percent. Watching to see if KFC can correct this arrow will be an intriguing prospect moving forward. Overall, the brand is generating solid sales. In the second quarter, KFC posted a system sales lift of 6 percent versus the prior-year period. Same-store sales were up 2 percent, year-over-year. U.S. same-store sales were even year-to-date, while international rose 2 percent. Those numbers were 1 and 2 percent in Q2, respectively. The brand recently also tapped Tony Lowings to replace Roger Eaton as KFC Division chief executive officer, effective January 1. Eaton, who has been with the company for more than two decades, including leading the KFC brand globally since 2014, is retiring at year’s end. Lowings is also a longtime YUM! employee. The 24-year YUM! vet currently serves as KFC Division president and chief operating officer.
Check out the entire Drive-Thru Study here.
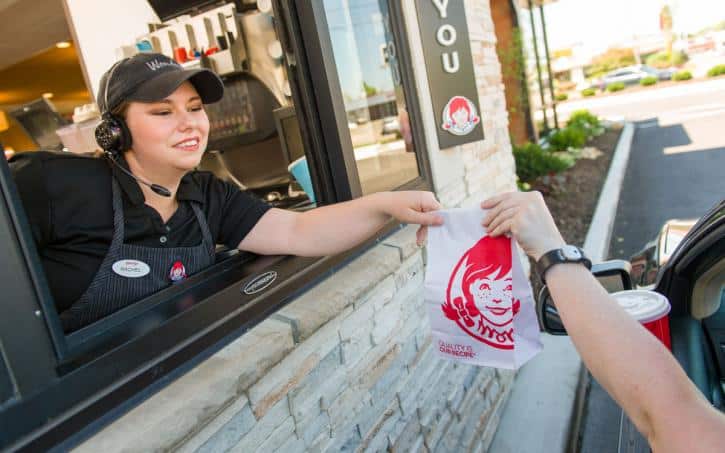
4. Wendy’s
Average time in seconds: 226.07
2017: 180.05 (third place)
2016: 169.11 (first place)
Wendy’s has dipped from its perennial top spot in recent years, but that doesn’t mean it’s not improving in other ways. Deepak Ajmani, vice president of restaurant services for Wendy’s, told QSR the company continues to work on its ordering app as a seamless brand experience, and the possibilities of that syncing up with the drive thru are tantalizing.
“If you think about mobile devices as a handheld kiosk, there’s a lot of opportunity for growth there,” Ajmani says. “Imagine a fast-food world where you place your order on your phone, drive up to the pick-up window, and there it is. Made fresh, just as you ordered.”
“It’s proven to be tricky to navigate operationally,” he added. The company tests its drive-thru innovations in its Wendy’s 90° Labs facility in Columbus, Ohio. Last year, for example, Wendy’s tested consumer ordering behavior and explored different stress levels by placing kiosks in various positions around the restaurant, and hosted mock drive-thru orders using a golf cart. In other words, everything going on, inside and out, industry-wide and in-house, is affecting Wendy’s drive-thru business.
An area of improvement for Wendy’s could be service. The brand scored 41.6 percent on the amount of employees who said “please,” at the drive thru and 68.9 percent on those who smiled. The first figure was middle of the pack while the smile number was second to last, only behind Hardee’s (60.5 percent).
Check out the entire Drive-Thru Study here.
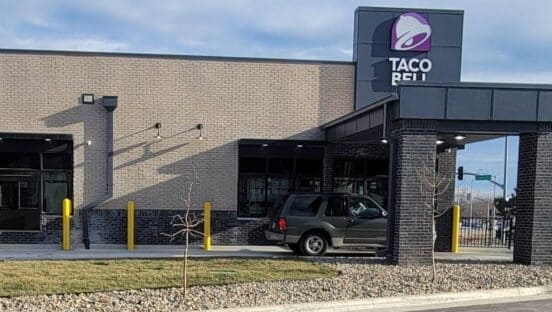
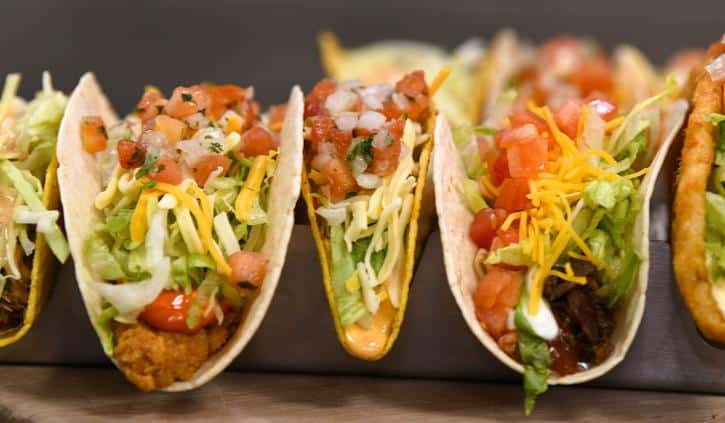
5. Taco Bell
Average time in seconds: 236.50
2017: 212.71 (sixth place)
2016: 220.11 (sixth place)
Mike Grams, Taco Bell’s chief operating officer, said the speed slow down fits with industry trends.
“Over the last five years, everybody has seen, as traffic has increased in the drive thru, times have slowed down,” he said. “Items per [transaction] has gone up almost a half item at Taco Bell in the last couple years, which is a great thing, but it also means something else has to be produced with every order.”
Gram also said there seems to be some consumer learning needed with mobile order lanes. “I’m not sure that’s 100 percent the way to go,” he added. “If I get enough volume to have another lane, great, but I think there’s still so much room for us to grow in the space today.”
Taco Bell is looking closely at digital menuboards, particularly those that integrate an order-confirmation board. The boards would allow Taco Bell to change the menu based on daypart, something that Grams says can accommodate “more time-sensitive” meal occasions throughout the day.
“We know the No. 1 pain point for the drive-thru experience today is actually at the order point, and that hasn’t changed in the 15 years that I’ve worked in drive thrus,” Grams said. “How do you make that faster? How do you make it easier? How do you make it more readable and more enjoyable? Where you see us experiment and prototype and try different things will be around that area.”
Taco Bell scored solid marks on other details: order accuracy (91.5 percent), saying thank you (89 percent), eye contact (89 percent), and pleasant demeanor (85.3 percent).
Check out the entire Drive-Thru Study here.
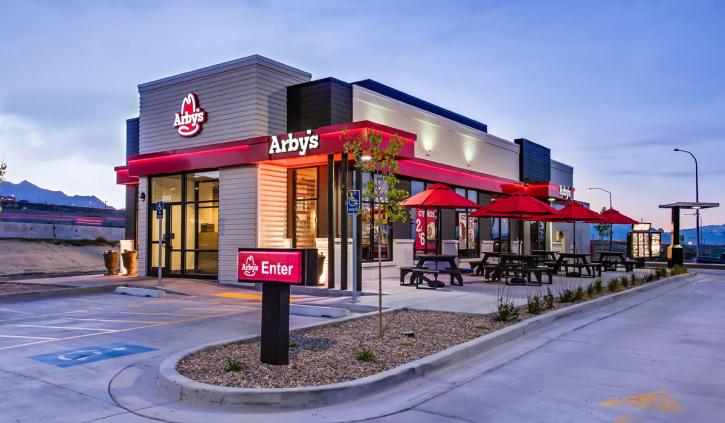
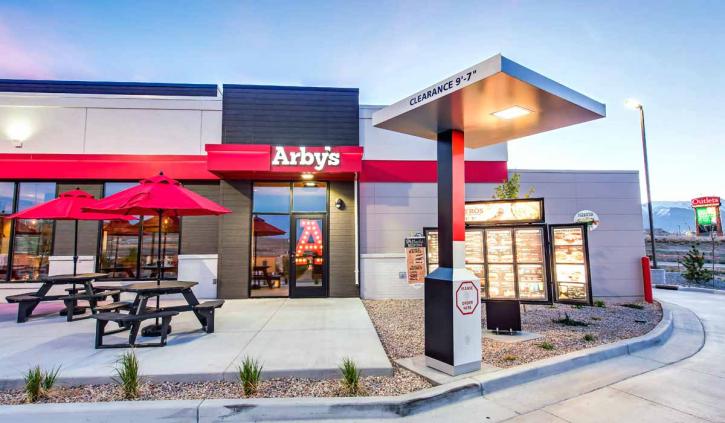
6. Arby’s
Average time in seconds: 237.93
2017: 244.37 (10th place)
2016: 225.31 (seventh place)
Perhaps the biggest note about Arby’s this year is its improvement in order accuracy. Arby’s hit 95.2 percent, only trailing Chick-fil-A’s 97.3 percent. That’s a strong nearly 5 percent lift from last year’s 90.5 percent. It was 91.3 percent in 2016. Given the speed improvement as well, Arby’s drive-thru experience made great strides this past year. John Kelly, chief operating officer at Arby’s, said the company removed much of the suggestive selling and instead allowed the guests to have more control over the drive-thru experience.
“We really said, this is their time, so instead of all that, we say, ‘Welcome to Arby’s; order when ready,’” he said.
Arby’s employees saying “please” metric was last in this year’s study at 38.7 percent. Pleasant demeanor, though, was a solid 87.7 percent and “thank you” was third overall at 93.3 percent. Kelly said Arby’s drive thru, regardless of trends, would continue to try to please its guests.
“One of the mistakes you could make is moving into some of the trends around some of the technology and some of the things that are cool and fresh and really seem cutting edge,” Kelly said. “If the guest doesn’t want to experience it that way, I don’t know if it’s going to be good for the business, and certainly not for the guest.”
Check out the entire Drive-Thru Study here.
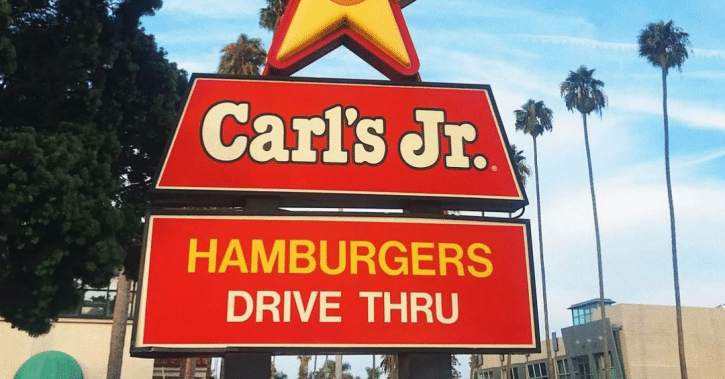
7. Carl’s Jr.
Average time in seconds: 252.91
2017: 270.22 (14th place)
2016: 268.89 (13th place)
The CKE brand boosted its drive-thru times by close to 20 seconds this past year. Tom Brennan, CKE’s COO, said the company is constantly reviewing its drive thrus, and made a concerted effort to speed up the experience, especially around the busy lunch daypart. This year, CKE introduced a restaurant excellence team made up of experts and engineers that is “keenly focused on understanding the operational impact” of everything it does in the restaurants. In addition, he says, CKE does a deep dive into its drive thru every quarter, experiencing it as if through the eyes of the customer so that it can improve upon any hold-ups.
“By continuously working to simplify the operation, we lay the foundation for consistent execution,” Brennan says.
Carl’s Jr. was solid across the board, proving the effort is paying off. Order accuracy: 87.7 percent; pleasant demeanor: 86.3 percent; smile: 76.3 percent; thank you: 91.3 percent. Also, for favorable exterior appearance, Carl’s Jr. was second overall at 98.8 percent, just behind Chick-fil-A’s perfect 100.
Check out the entire Drive-Thru Study here.
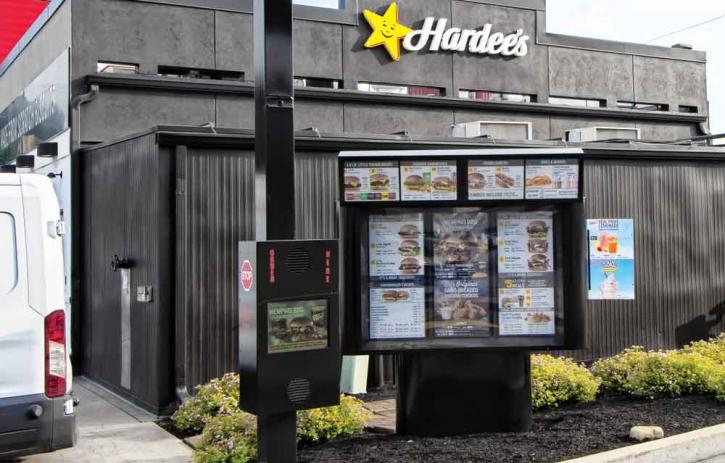
8. Hardee’s
Average time in seconds: 255.83
2017: 287.87 (last place)
2016: 273.73 (14th place)
Not surprisingly, Hardee’s performance runs close to Carl’s Jr. The sister brands, which split from a marketing perspective earlier in the year, are working to improve many of the same aspects—and succeeding. Hardee’s speed jumped 30-plus seconds, which is an impressive tick in a calendar turn. It goes back to many of the same things Brennan said in the previous slide. CKE has made a lot of changes under CEO Jason Marker, who moved over to the company from KFC in March 2017. The most visible one, perhaps, was a shift from racy ads.
On the drive-thru side, Hardee’s, like Carl’s Jr. turned in strong metrics in some key areas. Order accuracy: 92 percent; thank you: 87.2 percent; eye contact 84.9 percent. The chain could use some improvement in smile (60.5 percent, last among brands), and please (40.7 percent). Hardee’s also scored a 92 percent in favorable exterior appearance, which was bottom of the pack.
Check out the entire Drive-Thru Study here.
9. Chick-fil-A
Average time in seconds: 260.85
2017: 251.04 (11th place)
2016: 257.64 (11th place)
So Chick-fil-A isn’t all that fast in the drive-thru. Does it matter? No, which is really the perfect case for why overall speed is declining. Here’s why. Chick-fil-A may be on the bottom rung of the seconds meter, but it’s pretty much top of the pack everywhere else. One statistic that was extremely telling was vehicles in line. For the six or more vehicles note, Chick-fil-A had 38.9 percent (meaning nearly 40 percent of the time there are six-plus cars in line). Next: McDonald’s at 11.9 percent. Only Taco Bell (2.4 percent) and Wendy’s (1.8 percent) had more than a single percentage point. Four brands had zero. What does that tell us? Well, for starters it says there’s a bunch of people eating at Chick-fil-A. With the best average-unit volumes in the business ($4.1 million, Whataburger is No. 2 at $2.76M), the chicken chain is crushing sales. And this is while being open only six days a week.
But across the board Chick-fil-A returned enviable drive-thru figures:
Order accuracy: 97.3 percent (No. 1)
Eye contact: 92.4 percent (No. 1)
Please: 67.6 percent (No. 1)
Pleasant demeanor: 94.6 percent (No. 1)
Smile: 91.4 percent (No. 1)
Thank you: 94.1 percent (No. 2)
Favorable exterior appearance: 100 percent (No. 1)
If all those No. 1s is the price for slower speed, I think any and every operator in the country would sign up. Right now.
Check out the entire Drive-Thru Study here.
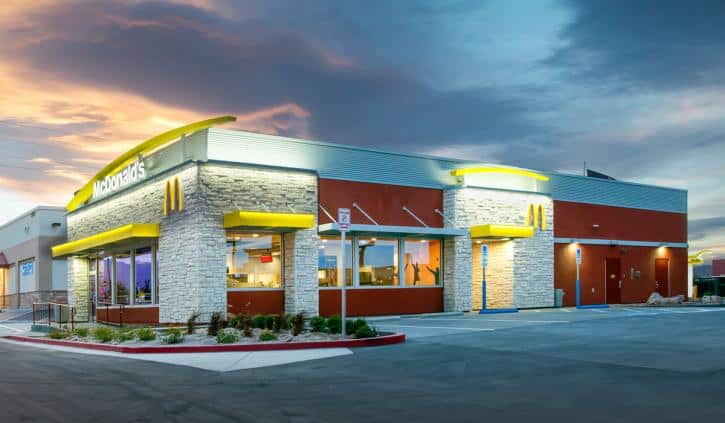
10. McDonald’s
Average time in seconds: 273.29
2017: 239.03 (ninth place)
2016: 208.16 (fifth place)
As we get to the final brand in the study, one thing is becoming crystal: Being fast doesn’t mean being the busiest. McDonald’s and Chick-fil-A top two of the most telling categories (AUV in Chick-fil-A’s case and average U.S. systemwide sales in McDonald’s at $37,480.67 in millions). Even so, it’s interesting to see how much slower McDonald’s has gotten in a three-year span. Even this past year alone was a 34-second decline. Is that related to the continued roll out of Experience of the Future designs? Hard to say. McDonald’s has also made wide curbside improvements. McDonald’s mobile order and pay app rolled out nationwide over the course of 2017 and allows guests to order and pick up from the counter, drive thru, or curbside. How has this all affected throughput? It’s something we’re going to start witnessing as time goes by and McDonald’s keeps rolling these refreshes out. The kiosk-centric design is likely to affect the entire operation, drive thru included. Is a trade-off speed? Again, there are a lot of questions and it’s probably too early to have definitive answers. Yet given the fact McDonald’s is forking up $6 billion on these remodels to accelerate around the country, we shouldn’t have long to wait. Let’s check some other drive-thru vitals for McDonalds:
Order accuracy: 92. 9 percent (third)
Eye contact: 85.3 percent (eighth)
Please: 41.7 percent (fourth)
Pleasant demeanor: 76.1 percent (last)
Smile: 73.6 percent (seventh)
Thank you: 89.6 percent (sixth)
Favorable exterior appearance: 97.6 percent (tied for third)
Check out the entire Drive-Thru Study here.