


Jumping in
It’s going to take a long time to truly weigh the effect off-premises is having on restaurants. You could safely say quick service, historically, was defined by its ability to dish convenience and value. But today’s dynamic isn’t so clear. The rise of digital pathways and order accesibility are not a club reserved for a select few fast-food brands. For instance, chains across all sectors, from Outback to Shake Shack, deliver via third party. As do some grocers. It’s simply not a quick-service monopoly anymore.
But one element that remains (mostly) unique to the segment is the drive thru. So where is the aftershock felt here? In 2019, according to QSR’s 2019 Drive-Thru Study, customers spent an average of 255 seconds from speaker to order window—about 20 seconds longer than in 2018. In 2017, it was 224.77 and 226.30 the previous year. Sixteen years ago, the national average was about 190 seconds.
While that might seem counter-culture to what’s happening, you have to consider the elements at play. Mainly, added orders flooding in from incremental channels. It’s a rush to meet guests where they are at all times, which, suddenly, is everywhere. You could thank mobile for that.
Menus are becoming increasingly complex as restaurants try to stand out from competitors in an oversaturated market. Lanes are stuffing as spontaneous customers share space with guests picking up mobile orders.
Meanwhile, restaurants continue to invest in technology to shave seconds off the clock. Chick-fil-A employees stand outside with iPads, taking orders and payment. Arby’s, like many chains, is working to improve back-of-the-house operations in an effort to pick up transactions, like a more efficient production line that firms up an assembly line approach in each individual store. McDonald’s is pouring money into decision logic and technology capable of upselling customers, as well as voice-activated order taking. Could license plate scanners be next? And on the drive-thru wheel spins.
Here is a look at the 10 brands surveyed in this year’s study, in no particular order.
Methodology: Data for the 2019 QSR Drive-Thru Performance Study was collected and tabulated by SeeLevel HX. The study included 10 chains and data from 1,503 visits, with the following break-down of visits by chain: Arby’s (165), Burger King (165), Carl’s Jr. (82), Chick-fil-A (183), Dunkin’ (165), Hardee’s (83), KFC (165), McDonald’s (165), Taco Bell (165), and Wendy’s (165). Visits were conducted across the country, across all regions and dayparts. No restaurant location was visited more than once. All data was collected between June 1 and August 1.
Daypart analysis was based on the time of day of the visit—breakfast (5-9 a.m.), mid-morning (9-11:30 a.m.), lunch (11:30 a.m. to 1:30 p.m.), late afternoon (1:30-4 p.m.), and dinner (4-7 p.m.). The distribution of visits mirrored revenue by daypart.
Upon each visit, a data collection researcher surveyed the drive-thru lane and then entered the line as any other customer. Each order placed by our researchers consisted of one main item, one side item, and one beverage. A minor special request was also made with each order, such as beverage with no ice. Although two different speed-of-service times were recorded for each visit (one for the researchers’ order/experience and another from a randomly selected vehicle), all tables within this feature are related to the researchers’ own vehicle and experience only, as this was the controlled order. Service time was defined as the time from stopping at the order station to receipt of all items (including change). Additional data collected by each researcher included but was not limited to: order accuracy, drive-thru and exterior appearance, speaker clarity, and customer service. All purchases were made using cash so as not to influence timing.
McDonald’s
Average time in seconds: 284.05
2018: 273.29 (10th place overall)
2017: 293.03 (ninth place)
2016: 208.16 (fifth place)
Where to begin. The top earner in fast food has put improving the drive thru experience, where two-thirds of its sales come from, on the front burner all year. CEO Steve Easterbrook even noted earlier he was personally taking the task on. McDonald’s is attacking the initiative on multiple fronts.
One is drive-thru competitions, which pits regions of the country against each other, with incentives funded by the company. Easterbrook said last quarter this helped boost service times 15 seconds in June, and the company expects by year’s end to improve the run-rate in service times by about 30 seconds, or roughly half of what it lost over the last three years.
Then McDonald’s started stripping complexity from its menu, which has climbed in recent years thanks to Signature Crafted items, All-Day Breakfast, and fresh beef. The chain has responded by removing the first, simplifying late-night lineups, and offering operators more flexibility with All-Day Breakfast.
But perhaps the buzziest of all McDonald’s moves involves its aggressive foray into tech. The chain spent $300 million on decision logic company Dynamic Yield in late March. It then forked up an undisclosed sum on Apprente, an early stage leader in vice-based conversational technology. Dynamic Yield’s drive-thru tech is now live in more than 8,000 U.S. restaurants, with plans for a systemwide rollout by 2020. The platform leverages personalization by varying outdoor digital drive-thru menu displays to show food based on time of day, weather, current restaurant traffic, and trending menu items. Critically, though, it also instantly suggests and displays more items to a customer’s order based on their current selections. It’s an upselling tool that could redefine how fast-food brands approach the process. Meanwhile, Apprente will, eventually, enable McDonald’s to provide faster, simpler, and more accurate order taking at the drive thru.
Needless to say, the chain is pulling out more than a few stops to get its drive thru humming along. There’s no secret why. Beyond just the amount of sales McDonald’s appreciates from the channel, there is massive revenue to be gained from generating more transactions through speed, especially at breakfast. Here’s a look at just how big the opportunity really is.
How McDonald’s performed in other areas:
Order accuracy: 84.8 percent
Eye contact: 86.1 percent
Says please: 37.6 percent
Pleasant demeanor: 75.2 percent
Smile: 69.1 percent
Says thank you: 84.8 percent
Check out the entire Drive-Thru Study here
Dunkin’
Average time in seconds: 216.75
2018: 200.74
2017: 173.85
2016: 181.03
To put into perspective how much times have changed, Dunkin’s 216.75 result would have ranked sixth in 2016. Eighth in 2017. But, again, while there might be more tools at the ready, speed of service has never been as complicated for fast-food chains. Dunkin’ likely rose to the top thanks to simpler breakfast, coffee, and treats. The chain has cut 10 percent of its menu over the past two years or so. Additionally, Dunkin’s redesigned prototype is a sign of things to come.
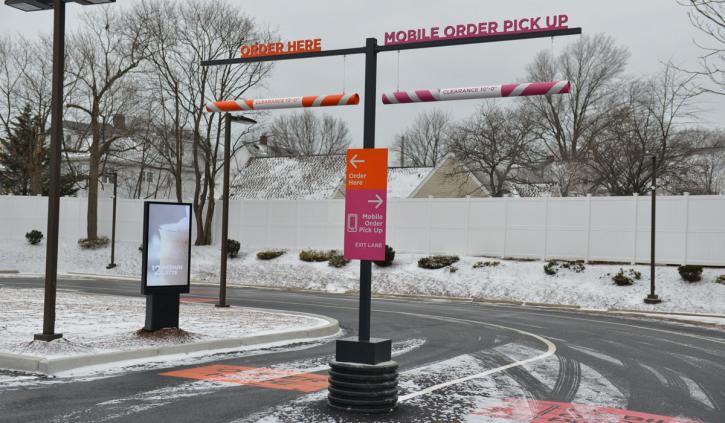
“At several of our Dunkin’ NextGen locations, we feature an On-the-Go drive-thru lane, which allows guests who order ahead through the Dunkin’ mobile app to bypass the regular drive-thru lane to pick up their orders and get on their way even faster than before,” Scott Murphy, COO for Dunkin’ U.S., told QSR.
Expect to see more chains follow in Dunkin’s path.
One thing worth keeping an eye on in 2020 and beyond is how Dunkin’s beverage innovation drives trial in the afternoon. Some espresso deals are designed to surge p.m. sales, especially in the drive thru where guests might be on their way home or back to work. Dunkin’ has also made a concerted effort in recent weeks to improve mobile ordering and rewards.
Here’s a look at some of Dunkin’s other vitals from this year’s study:
Order accuracy: 84.2 percent
Eye contact: 88.5 percent
Says please: 50.3 percent
Pleasant demeanor: 85.5 percent
Smile: 77.6 percent
Says thank you: 81.8 percent
Check out the entire Drive-Thru Study here
Chick-fil-A
Average time in seconds: 322.98
2018: 260.85 (ninth place overall)
2017: 251.04 (11th place)
2016: 257.64 (11th place)
Let’s start by addressing the massive cow in the room. A variety of outlets have picked up our Drive-Thru Study in recent days, positioning their pieces around this headline: “Chick-fil-A has the slowest drive thru in America.” That’s really not an accurate way to look at the data, or at least a very incomplete approach. The idea that speed, and speed alone, inspires success is flawed. Chick-fil-A looks to volume. Average ticket and number of cars drives revenue. As Scott Marentay, global director of innovation at Acrelec America points out, some of the brand’s busiest locations can move 300 cars in an hour. Look at it this way: If you’re a restaurant chain with no line, does it make sense to hurry cars through quickly if nobody is waiting? Chick-fil-A’s speed of service is less a fault of its own operations as it’s a result of its rampant success. Constantly crowded lanes slow the figure. But does it mean Chick-fil-A is lagging at serving drive-thru customers? No. Diners just, on average, wait longer for food because there are more cars in line.
Here’s a clear look at what’s happening: In the “vehicles in line” chart, Chick-fil-A had six or more cars 35.5 percent of the time. No other chain cracked 10 percent (McDonald’s was next at 9.1 percent). Six brands reported at zero. For three to five cars, Chick-fil-A was 41.5 percent. McDonald’s was next again at 32.7 percent, but nobody else topped 20 percent. For 0–2, Chick-fil-A was a paltry 23 percent. Every other chain was above 50 percent. The average was 75.2 percent. Eight chains passed 80 percent. What that tells us is that Chick-fil-A is almost always crowded. Rolling up and discovering otherwise is a rare event. And like Marentay said, it’s not a matter of looking at speed and saying, it took customers longer to get through, so Chick-fil-A must be delivering slower; it’s just the result of another truth—that Chick-fil-A is simply killing it.
As of year-end 2018, Chick-fil-A was one of only five restaurant chains in America pushing $10 billion in sales, joining McDonald’s, Starbucks, Subway, and Taco Bell. But here’s a glance at the domestic unit counts, in respective order: 13,914, 14,825, 24,798, 6,588, and 2,400. Chick-fil-A is competing at the very top with far less restaurants. Not to mention being closed on Sundays. The brand’s average-unit volumes in 2018 were $4.17 million. The next best in all 50 chains listed: Raising Cane’s at $2.96 million.
And we haven’t even talked about Chick-fil-A’s other drive-thru metrics. As you can see, the chain is an industry standard-bearer across the board. Don’t get lost in the speed bubble so many people latch onto.
Order accuracy: 94 percent (first overall)
Eye contact: 93.4 percent (first overall)
Says please: 62.8 percent (first overall)
Pleasant demeanor: 93.4 percent (first overall)
Smile: 91.3 percent (first overall)
Says thank you: 90.7 percent (second overall)
Khalilah Cooper, director of service and hospitality for Chick-fil-A, said the chain is looking to tech to quicken the process and improve customer experience further. Employees are posted outdoors with iPads at many locations. That’s also an important factor to note as you consider speed of service, and where it’s really measured from. It’s not the same for Chick-fil-A as other chains that only take orders at the board. “We are embracing technology to both provide a better experience for guests and to help take tasks off restaurant team members so they can devote more time to hospitality for our customers,” Cooper said.
“We think that customer service is critical, especially in an environment like the drive thru where the customer has limited touch points to experience our people and our brand,” she added. “Team members deliver what I like to call microbursts of hospitality to make sure our customers know we care about them.”
Check out the entire Drive-Thru Study here
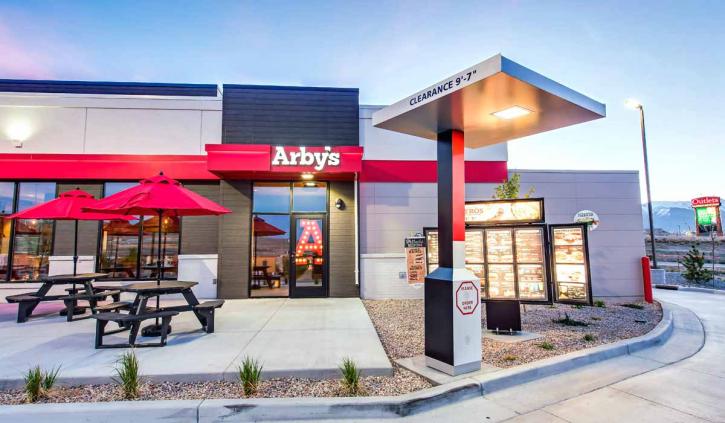
Arby’s
Average time in seconds: 263.46
2018: 237.93 (sixth place overall)
2017: 244.37 (10th place)
2016: 225.31 (seventh place)
Arby’s chief operating officer John Kelly set the chain’s internal target speed of service at 200 seconds. The challenge has been balancing ever-developing menus that feature higher-quality, more imaginative sandwiches (and thus more preparation) with execution. The answer: A more efficient production line that can quickly assemble orders in time for a customer’s arrival at the pick-up window.
Arby’s said it’s focused on firming up an assembly line model in each individual store. “We know we’ve got very complex menu items, and our guests are demanding those, so we have to make sure that the engine that we build in our kitchen is able to execute them in a very efficient way,” Kelly told QSR.
This is a critical point across the board, not just with speed.
“If you just add complex items to a menu and don’t change the procedures required to put those items together, there’s going to be a lot of inaccuracy. We have some of the most complexity in the industry, and we’re able to execute it because we’re building a production line that allows us to be efficient,” Kelly added.
On that note, Arby’s reported an impressive 86.1 percent order accuracy result. Kelly also talked about order confirmation boards, where Arby’s had 15.2 percent present in locations surveyed. “The original iterations of the order-confirmation boards, we’ve come a long way from that,” Kelly said. “And you know, they’re almost interactive to the point [where] even some AI is built in there on what can be purchased and added on. There’s some big opportunity there as long as it’s done thoughtfully and you don’t create an overwhelming experience for the guests in the drive thru.”
Kelly sounded off on suggestive selling, too, saying that Arby’s employees are directed to play each interaction by ear. So, if the drive thru isn’t too busy or if a customer orders very quickly and can afford a bit more time at the order station, workers can engage that guest with a suggestive sell. It affords employees a chance to show some personality as well.
“If my team isn’t running a fast and efficient drive thru that’s as friendly as possible and hitting 100 percent accuracy, quite honestly, I don’t need them doing any suggestive selling,” he said. “If you’re running a very efficient drive thru and somebody just ordered a sandwich and a drink, I want you to make sure that you let them know they can have some great Curly Fries to complete the deal.”
Here’s a look at how Arby’s performed in some other areas:
Eye contact: 87.9 percent
Says please: 47.9 percent
Pleasant demeanor: 89.1 percent
Smile: 74.5 percent
Says thank you: 89.1 percent
Check out the entire Drive-Thru Study here
Wendy’s
Average time in seconds: 230.38
2018: 226.07
2017: 180.05
2016: 169.11
Despite a slight slowdown in service times, 2019’s result marks a positive climb up the speed latter for Wendy’s, which once ruled the category. Wendy’s still holds the all-time Drive-Thru Study best of 116 seconds posted back in 2003. That year, the national average was about 190 seconds.
Circle Wendy’s decision to try breakfast again as a trend to follow. Breakfast is a habitual and profitable daypart but it’s hard to break in and compete, and it’s not the easiest to execute. Wendy’s said it planned to hire roughly 20,000 employees and invest $20 million to get restaurants ready.
Will that be enough to inspire franchisees to keep at it? Past efforts were a bit rocky but Wendy’s believes it’s well positioned to excel with a more brand-focused approach. How this affects the drive thru is going to be a very interesting side story. The potential is massive. Yet there’s no doubt it’s going to be tricky at times.
Here’s a look at how Wendy’s performed in some other areas:
Order accuracy: 87.3 percent
Eye contact: 84.8 percent
Says please: 45.5 percent
Pleasant demeanor: 79.4 percent
Smile: 71.5 percent
Says thank you: 89.1 percent
Check out the entire Drive-Thru Study here
Burger King
Average time in seconds: 235.48
2018: 193.31
2017: 189.48
2016: 201.18
Burger King took a pretty big speed drop this year from last, when it topped the study. It’s difficult to pinpoint why exactly but the number could trend positive moving forward given the chain’s decision to accelerate closures. Burger King is trimming lower-volume stores in favor of units designed to unlock digital changes. The “Burger King of Tomorrow” design features double drive-thru lanes and outdoor digital menuboards. CEO Jose Cil said the latter drives higher checks and allows for integration with other technologies, like mobile apps. It also provides franchisees cost savings on printed menu and media signage.
At Restaurant Brands International’s investor day in May, the company said, over the next two years, it expects to shutter 200–250 restaurants—an acceleration from the last couple of years. Burger King opened net 104 domestic stores in 2018 and 70 the prior year. During that span, it averaged about 140 closures of underperforming venues. Last year, Burger King opened about 200 and closed 100. In other terms, by the time the U.S. closure program slows down, the brand’s drive-thru footprint will look very different. How that affects results remains to be seen, but tests so far point to more visits and long-term comparable sales growth, the company said. A double drive-thru lane is a great place to start.
Here’s a look at how Wendy’s performed in some other areas:
Order accuracy: 90.3 percent (second only to Chick-fil-A)
Eye contact: 88.5 percent
Says please: 44.8 percent
Pleasant demeanor: 81.2 percent
Smile: 71.5 percent
Says thank you: 86.7 percent
Check out the entire Drive-Thru Study here
Taco Bell
Average time in seconds: 240.38
2018: 236.50
2017: 212.71
2016: 220.11
Taco Bell’s 4-second decline might be deceptive. Yum! Brands COO (and soon-to-be CEO) David Gibbs said earlier in the year that Taco Bell saw 6 million more cars come through its drive thrus compared to Q2 2018. In that set, the experience was timed at an average of 7 seconds faster. So, even if the overall picture is a few ticks slower, if you factor in all those added cars, it paints a different picture. Taco Bell, throughout the year, has spoken to using speed as a lever to unlock transactions. In Q4 of fiscal 2019, overall speed of service improved 3 seconds at lunch and 2 seconds at dinner. While that seems small, Gibbs said this helped drive more than 4 million additional transactions during the period.
In last year’s Drive-Thru Study, Taco Bell’s COO Mike Grams said items per transaction were up almost a half item at Taco Bell in the last couple of years. Great, but it also means something else has to be produced with every order, slowing down the drive thru. Grams added that the No. 1 pain point at the drive-thru experience remains the order point, “and that hasn’t changed in the 15 years that I’ve worked in drive thrus.” Sixteen years in, you could probably bank on that sentiment remaining true.
“We are rolling out a new kitchen display system, which will present the customer’s order in more detail,” he told QSR this year. “Digital menuboards also play a huge role in alleviating some of the stressors in navigating a menu. Furthermore, we are testing the use of video for order confirmation.
Taco Bell was on the high-end of this year’s study when it comes to order-confirmation boards. The chain featured the polarizing technology in 84.8 percent of its locations surveyed. For perspective, Dunkin’ was just 7.3 percent.
Taco Bell had digital menuboards present in 17.6 percent of the stores and a pre-sell menu 37.6 percent of the time.
Here’s a look at how Taco Bell performed in some other areas:
Order accuracy: 83.6 percent
Eye contact: 83 percent
Says please: 45.5 percent
Pleasant demeanor: 76.4 percent
Smile: 72.1 percent
Says thank you: 84.8 percent
Check out the entire Drive-Thru Study here
Carl’s Jr.
Average time in seconds: 240.51
2018: 252.91
2017: 270.22
2016: 268.89
CKE’s brand is the first chain to boast a year-over-year speed boost from 2018 so far. In fact, Carl’s Jr. has been on a pretty industry-defying run in recent years. The chain’s time is nearly 30 seconds faster than 2017. Last year, the company introduced a restaurant excellence team comprised of experts and engineers focused on operations. COO Tom Brennan told QSR in 2018 that CKE was improving consistency and execution by focusing on simplification and conducting a deep dive into its drive thru every quarter to identify bottleneck issues. The effort appears to be paying off.
Beyond speed, Carl’s Jr. had a solid showing in several categories. One that stands out is saying “thank you.” At 95.1 percent, the brand eclipsed customer service front-runner Chick-fil-A (90.7 percent) to lead all chains.
Order accuracy: 84.1 percent
Eye contact: 89 percent
Says please: 53.7 percent
Pleasant demeanor: 91.5 percent
Smile: 75.6 percent
Says thank you: 95.1 percent.
Check out the entire Drive-Thru Study here
KFC
Average time in seconds: 243.73
2018: 218.95
2017: 230.98
2016: 203.91
Yum!’s chicken giant has traded slow and fast performance over the past four years. But some of the chain’s other metrics are more interesting to follow. For instance, KFC’s order accuracy clocked in at 69.9 percent last year—last among the brands surveyed. That remained the case in 2019 at 66.1 percent. It’s been a downward trend since 2017’s 83.20 percent figure and 2016’s 88.6 percent. It will be worth following in the years to come to see if KFC can reroute the result. There is also some room to grow with service attributes, although KFC was a solid performer overall.
Eye contact: 81.8 percent
Says please: 38.8 percent
Pleasant demeanor: 78.2 percent
Smile: 67.3 percent
Says thank you: 86.1 percent
This past year has been a stellar one for KFC as it drives quality and customer experience elements into its offerings. In Q2, the brand delivered its 16th consecutive quarter of positive same-store sales growth. KFC’s U.S. comps lifted 2 percent, year-over-year, while its international business boomed 6 percent. Impressively, KFC saw widespread strength across the world, leading to global system sales gains of 10 percent as net new unit expansion upped 6 percent. KFC opened 232 net new units in the quarter. Eight out of 13 markets reported at or above 6 percent same-store sales gains for KFC in the period. The brand’s average-unit volumes rose in 2018 to $1.21 million from $1.2 million the previous year.
Check out the entire Drive-Thru Study here
Hardee’s
Average time in seconds: 266.34
2018: 255.83
2017: 287.87
2016: 273.73
Like Carl’s Jr., Hardee’s has made progress in recent years. While the times don’t appear all that different, put into long-term context they illustrate something different. In 2016, for example, a 273.73 result was well behind the pack—the fastest chain (Raising Cane’s) was 168.23 seconds. This year’s figure is pretty much on par with how most brands are performing. And much of the improvement comes down to the same efforts its sister brand is rolling out.
Across the board, Hardee’s showed solid:
Order accuracy: 80.7 percent
Eye contact: 83.1 percent
Says please: 37.3 percent
Pleasant demeanor: 75.9 percent
Smile: 68.7 percent
Says thank you: 84.3 percent
Check out the entire Drive-Thru Study here