Watch: Buffalo Tops Growth 40 List
Sitting on the edge of the U.S.-Canadian border and taking a backseat to another, more cosmopolitan, Empire State city, Buffalo, New York, often falls into the background. The city’s beloved NFL team plays the occasional home game in Toronto, its intense winters freeze out Niagara Falls–bound tourists, and the City of Good Neighbors’ meat-and-potatoes character doesn’t incite a barrage of flashy adjectives.
For many, Buffalo fails the eye test. It seems a city lumbering along in the 21st century and a spot on the U.S. landscape few would peg for growth, let alone label an urban metropolis poised to welcome quick-service restaurants.
Take a closer look, however, and Buffalo’s restaurant-industry appeal is real.
“Most companies would look at Buffalo as a tier-two or tier-three market, but there’s plenty to like,” says Moe’s Southwest Grill president Paul Damico.
In 2005, Moe’s opened its first two Buffalo outlets. Today, the fast-casual Mexican eatery has five area restaurants, including one at the University of Buffalo, with three
additional locations on the horizon. Damico sees even more opportunity.
“You’ve got pockets of affluent areas and a metropolitan area that isn’t littered with competitors,” he says. “Plus we see a strong presence of health care, which can lead to great catering opportunities and a steady employment base.”
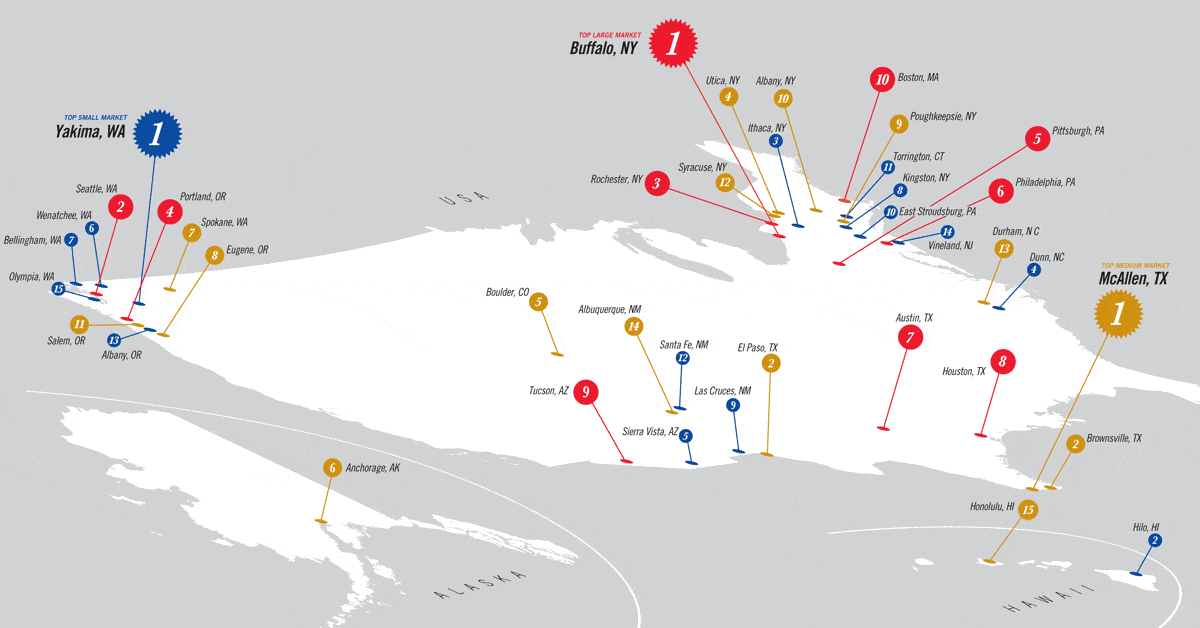
Among the nation’s largest metropolitan markets, Buffalo secured the top spot in this year’s Growth 40, performed by Pitney Bowes Business Insight, a Troy, New York–based company that helps retailers acquire, serve, and grow customer relationships. Combining data, such as the area’s restaurant landscape, with a forward-looking view including changes and projections in unemployment, retail sales, home price, and disposable income, the report identifies the nation’s top 40 markets (10 large, 15 medium, and 15 small) poised for quick-service growth.
Large Markets
| TOP 10 Large Markets | QSR Units | Population Per QSR Unit |
Growth Index 2005-2014 |
Population in 2014 |
Households in 2014 |
Median Household Income |
|
| 1 | Buffalo, NY | 257 | 4,367 | 122.93 | 1,134,119 | 488,418 | $44,615 |
| 2 | Seattle, WA | 1,046 | 3,220 | 130.12 | 3,627,317 | 1,462,844 | $63,432 |
| 3 | Rochester, NY | 314 | 3,309 | 120.27 | 1,057,988 | 436,494 | $53,285 |
| 4 | Portland, OR | 709 | 3,123 | 121.20 | 2,438,133 | 950,364 | $55,146 |
| 5 | Pittsburgh, PA | 747 | 3,150 | 117.95 | 2,382,668 | 1,044,512 | $43,107 |
| 6 | Philadelphia, PA | 1,565 | 3,751 | 115.83 | 6,019,004 | 2,415,826 | $56,995 |
| 7 | Austin, TX | 646 | 2,627 | 132.12 | 1,940,040 | 738,949 | $58,835 |
| 8 | Houston, TX | 2,204 | 2,629 | 123.46 | 6,386,182 | 2,342,181 | $49,534 |
| 9 | Tucson, AZ | 338 | 3,036 | 116.38 | 1,103,889 | 450,798 | $44,414 |
| 10 | Boston, MA | 1,679 | 2,717 | 115.62 | 4,763,232 | 1,888,920 | $67,873 |
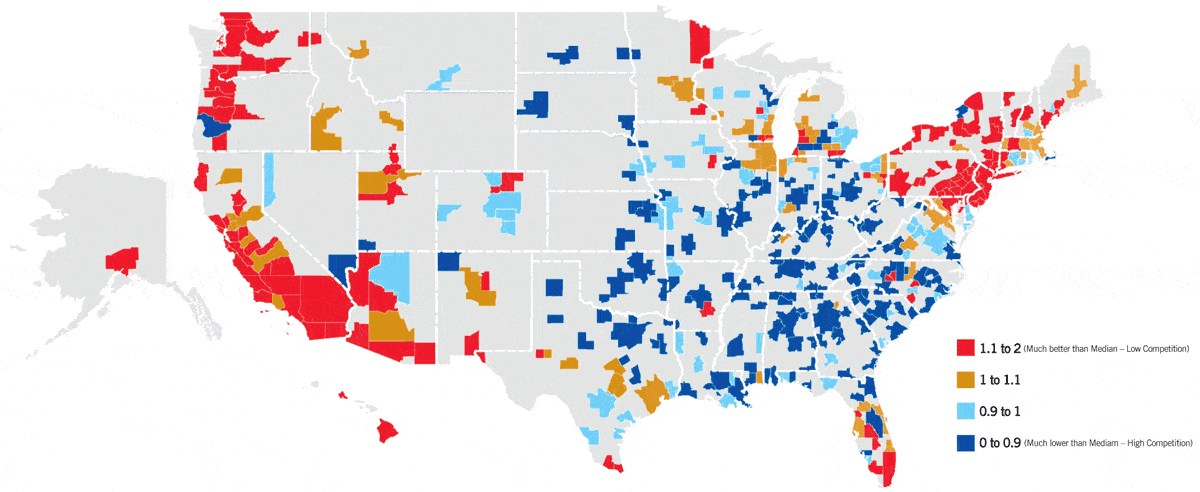
Quick-service competition weighed heavily in Pitney Bowes’ assessment—and for a logical reason.
“There are only so many food dollars available. The more competitive the marketplace, the less share a quick-service restaurant can capture,” Pitney Bowes’ client services manager Lynda Bednarczyk says.
In terms of existing quick-service competition, Buffalo outshines its big-city rivals. With only 257 quick-service chains in the Buffalo area—the study only counted those chains with 25 or more units, bypassing an area’s independents or small chains—there are a whopping 4,367 people for every quick-serve outlet; among other top markets, the population-per-quick-serve often hovers near 3,000.
“Competition is one of the key factors influencing market desirability because it can have a significant impact on the ability of quick-service restaurants to be successful,” Pitney Bowes’ director of client services Al Beery says. “Buffalo clearly separates itself from the pack with its favorable population-per-quick-serve figure.”
Yet, Buffalo’s promising competitive climate fails to tell the whole story.
Health care and education, two stable employment sectors, continue to grow in Buffalo, spurred in large part by the University of Buffalo and the Buffalo Niagara Medical Campus. Last June, Forbes named Buffalo one of the nation’s top 10 places to raise a family, hailing its low cost of living and wealth of educational opportunities.
“When you combine the modest competition level with decent growth factors, as Buffalo does, then the city’s appeal and potential becomes clear,” Beery says, noting that Buffalo’s diversified, conservative economy is expected to withstand any additional recessionary fallout.
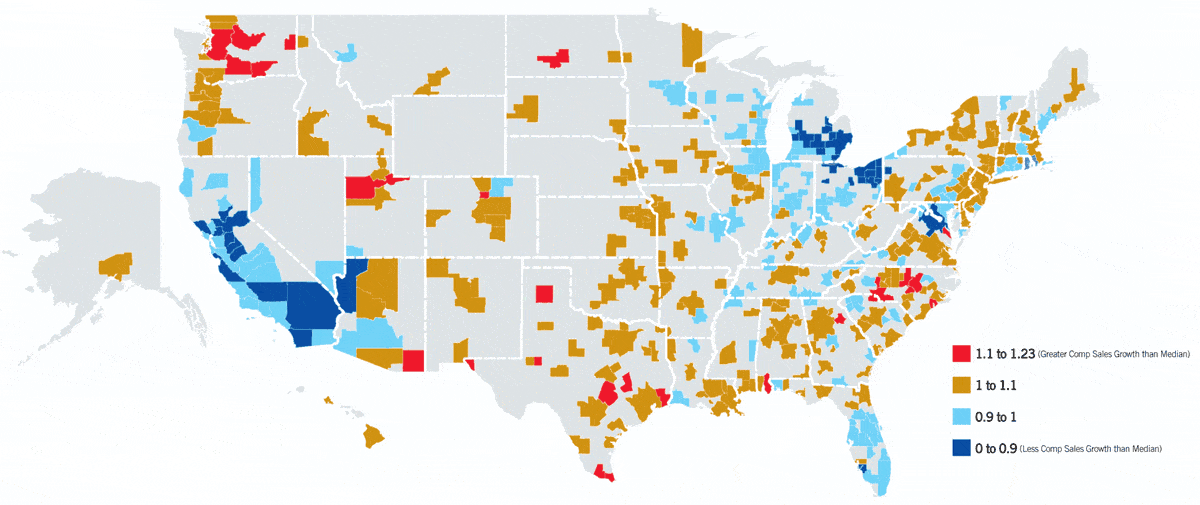
The second critical piece to Pitney Bowes’ report is its Growth Index, a past, present, and future look (from 2005 to 2014) at changes in unemployment, disposable income, retail sales, and home prices. Beery says a positive relationship exists between constructive changes in those four areas and quick-service sales growth.
“When retail sales, disposable income, and home prices go up with unemployment declining, then you’re looking at a positive opportunity for quick serves,” he says. “The more people available to patronize quick-service units, the better the situation for restaurants to make market headway.”
[pagebreak]
Among the top 40 markets, only Seattle and Austin, Texas, scored more than 130 points on Pitney Bowes’ Growth Index, catapulting the metropolitan areas to No. 2 and No. 7, respectively, among the Growth 40’s large markets.
Seattle benefits from an economy rooted in hard-charging 21st century companies, such as Microsoft, Starbucks, and Amazon. Internet and technology companies flock to the region, giving the city a robust, modern vibe, while an entrepreneurial spirit thrives to make the city an attractive place for business expansion of all types.
The Emerald City also holds a healthy median household income ($63,432 in 2009), a large collection of white-collar workers, and a population base expected to add as many as 250,000 residents by 2014. Such allure is expected to pull quick-service chains like Firehouse Subs into the region in swelling numbers throughout the coming years.
The size of each market was determined by the following population breakdowns: large markets have 1,000,000-plus citizens; medium markets have 250,000–1,000,000; and small markets have 100,000–250,000. Pitney Bowes Business Insights’ analysis reflects competitive metrics based on chains with at least 25 units.
“Particularly on the fast-casual side of the equation, we need to make sure we have enough folks that fit our target demographic,” says Firehouse Subs CEO Don Fox, who says Seattle and many of its Pacific Northwest neighbors hit the mark. While Fox hopes to expand Firehouse into Seattle within the next 2–3 years, current growth is centered in other promising large markets, including Philadelphia and Boston.
Like Seattle, Austin also carries compelling potential for quick-service restaurant growth.
Riding high among the nation’s most en vogue cities because of its diverse array of cultural and entrepreneurial opportunities, Austin is home to the 50,000-student University of Texas and boasts the list’s highest Growth Index score. The metro area is also expected to welcome nearly 250,000 residents and 100,000 households over the next five years, with many new residents, specifically young professionals, joining the area’s already vibrant white-collar workforce to spur quick-service potential.
Seattle and Austin also share another top 10 large-market trend. Each of the top 10 areas hosts a college as well as an anchor employer, factors that bode well for the quick-service sector and provide engaged customers, better insulation from economic fallout, and a viable employee pool.
Portland, Oregon, hosts Nike and adidas alongside a half-dozen colleges; Philadelphia and Boston both play to large college crowds and marquee national companies; Tucson has the University of Arizona, the U.S. Army Intelligence Center, and various Major League Baseball spring training locales that invite tourists; Pittsburgh hosts eight Fortune 500 companies and more than 20 colleges; Houston serves as the nation’s energy hub, while also holding more than 60 institutions of higher learning; and Rochester, New York, is home to Eastman Kodak and Bausch and Lomb, as well as the well-regarded University of Rochester.
Dunkin Donuts’ vice president of franchising and market planning Grant Benson says the presence of established corporations and a lively, youthful population is “indicative that there’s vibrancy in that market with continued development and emerging services. It goes beyond the potential customer base and speaks to a real investment in the community and a pro-business mindset.”
Medium Markets
| TOP 15 Medium Markets | QSR Units | Population Per QSR Unit |
Growth Index 2005-2014 |
Population in 2014 |
Households in 2014 |
Median Household Income |
|
| 1 | McAllen, TX | 222 | 3,326 | 127.70 | 828,514 | 245,121 | $27,731 |
| 2 | Brownsville, TX | 125 | 3,164 | 125.19 | 433,693 | 130,644 | $28,568 |
| 3 | El Paso, TX | 265 | 2,856 | 127.12 | 806,606 | 265,225 | $34,271 |
| 4 | Utica, NY | 78 | 3,780 | 119.29 | 298,564 | 120,947 | $40,145 |
| 5 | Boulder, CO | 103 | 2,846 | 125.83 | 319,825 | 136,560 | $65,011 |
| 6 | Anchorage, AK | 109 | 3,395 | 119.70 | 382,909 | 141,872 | $61,906 |
| 7 | Spokane, WA | 168 | 2,799 | 125.17 | 505,233 | 201,061 | $46,188 |
| 8 | Eugene, OR | 123 | 2,851 | 122.31 | 372,309 | 153,629 | $45,835 |
| 9 | Poughkeepsie, NY | 163 | 4,173 | 116.50 | 699,467 | 250,315 | $63,543 |
| 10 | Albany, NY | 296 | 2,909 | 121.31 | 882,768 | 367,718 | $52,851 |
| 11 | Salem, OR | 136 | 2,901 | 120.57 | 430,120 | 155,893 | $45,927 |
| 12 | Syracuse, NY | 216 | 2,991 | 120.16 | 654,644 | 270,681 | $46,437 |
| 13 | Durham, NC | 195 | 2,575 | 129.66 | 551,291 | 225,688 | $48,591 |
| 14 | Albuquerque, NM | 341 | 2,504 | 123.52 | 926,764 | 369,745 | $45,275 |
| 15 | Honolulu, HI | 266 | 3,482 | 114.16 | 911,480 | 328,995 | $64,544 |
[pagebreak]
Among medium-size markets, Texas reigns supreme, as the top three entries—McAllen, Brownsville, and El Paso—all call the Lone Star state home. Driven by finance and education, energy, and sprawl, Texas has become host to some of the nation’s most aggressive quick-service growth plans. CKE Restaurants, for instance, has nearly 300 commitments for Texas-based Carl’s Jr. outlets.
“Texas’ economy has held up stronger than most and is an attractive market overall because you can reach people at a rapid, cost-effective pace,” CKE Restaurants’ executive vice president of global franchise development Ned Lyerly says.
Ironically, McAllen and Brownsville, the top two among medium markets, also report the lowest median household income among the top 40. In fact, they are the only two markets with median household incomes below $30,000. Modest incomes, however, do not foster modest expectations. Both Texas metros located deep in the state’s south display favorable population-per-quick-serve figures, as well as high Growth Index scores.
As with the large markets, the Northeast, Pacific Northwest, and Southwest dominate among mid-size markets. Four New York metros—Utica, Poughkeepsie, Albany, and Syracuse—make the medium’s top 15. A pair of Oregon cities, Eugene and Salem, joins Spokane, Washington, in representing the Pacific Northwest, while Albuquerque joins the three Texas metros as Southwestern markets positioned for quick-service growth.
Among the contiguous 48 states, only Boulder, Colorado, and Durham, North Carolina, break the regional superiority. Boulder boasts the Growth 40’s most white-collar employment base (74 percent of its workers hold salaried jobs) while Durham holds one of the report’s highest Growth Index scores and remains rich in academic and health care opportunities. By 2014, Durham is expected to add nearly 50,000 residents, outpacing metro areas of a similar size.
Again mimicking their large-market brethren, the presence of a major university also bodes well for growth among mid-size metro areas, with El Paso, Boulder, Eugene, Syracuse, Durham, and Albuquerque also enjoying an expansive student base and the stability that comes with the university presence.
Although there’s also growth potential in Anchorage and Honolulu—two markets with tourist appeal and high median household incomes—operational challenges are likely to keep quick-service expansion in those distinct, even remote, markets at a moderate level.
“As promising as those markets are, you face the challenge of having a customer base that isn’t familiar with your product in addition to having a place so far away that it’s difficult to get product into stores,” Taco John’s vice president of development Brett Miller says of Anchorage and Honolulu.
Small Markets
| TOP 15 Small Markets | QSR Units | Population Per QSR Unit |
Growth Index 2005-2014 |
Population in 2014 |
Households in 2014 |
Median Household Income |
|
| 1 | Yakima, WA | 59 | 4,040 | 127.78 | 251,087 | 86,573 | $42,284 |
| 2 | Hilo, HI | 27 | 6,775 | 122.59 | 187,574 | 69,123 | $53,640 |
| 3 | Ithaca, NY | 26 | 3,914 | 121.47 | 105,440 | 41,067 | $46,724 |
| 4 | Dunn, NC | 33 | 3,437 | 125.01 | 129,162 | 48,639 | $40,244 |
| 5 | Sierra Vista, AZ | 40 | 3,256 | 125.90 | 136,648 | 53,977 | $35,890 |
| 6 | Wenatchee, WA | 34 | 3,193 | 126.10 | 117,525 | 44,740 | $40,717 |
| 7 | Bellingham, WA | 60 | 3,310 | 123.08 | 218,746 | 87,013 | $50,492 |
| 8 | Kingston, NY | 52 | 3,495 | 121.25 | 185,250 | 75,496 | $49,547 |
| 9 | Las Cruces, NM | 63 | 3,224 | 123.67 | 222,796 | 79,450 | $35,115 |
| 10 | East Stroudsburg, PA | 44 | 3,773 | 119.79 | 171,699 | 62,520 | $51,819 |
| 11 | Torrington, CT | 44 | 4,305 | 117.69 | 189,380 | 81,899 | $69,220 |
| 12 | Santa Fe, NM | 45 | 3,245 | 123.02 | 154,727 | 64,030 | $48,543 |
| 13 | Albany, OR | 36 | 3,286 | 121.61 | 128,021 | 49,256 | $44,182 |
| 14 | Vineland, NJ | 36 | 4,400 | 116.65 | 165,437 | 57,938 | $46,961 |
| 15 | Olympia, WA | 79 | 3,152 | 122.60 | 278,441 | 112,667 | $57,474 |
For Pitney Bowes’ analysis, it was critical to distinguish smaller metro markets (100,000–250,000 residents) to ensure a more accurate comparison and to identify future areas of growth that have not yet been tapped by many quick-serve brands.
Not surprisingly, the growing reigns of the Northeast, Southwest, and Pacific Northwest extend to the top 15 small markets as well, while only Dunn, North Carolina, and Hilo, Hawaii, break the regional strongholds. Among small markets, five call the Pacific Northwest home, five are in the Northeast, and three carry Southwestern addresses.
“A lot of this has to do with employment. You’ve got technology growing in the Pacific Northwest while Texas, like the Northeast, is driven by finance and education,” Beery says. “Areas in the Midwest, California, and the Southeast have been hard hit by important variables, including falling home prices and employment difficulties in core manufacturing.”
Taco John’s, which has carved a reputation in modest-size towns throughout its 42-year history, loves small-city America. The Wyoming-based chain utilizes cost-effective television advertising to prompt an initial trial, a reality it cannot mimic in big-city media markets. It also works to be the first quick-service Mexican eatery into the market to avoid competitive battles.
[pagebreak]
Yet for some brands, existing competition, particularly in smaller markets, is an advantage rather than a drawback.
Lyerly says CKE’s growth is not swayed by the presence of competitor brands. In fact, the CKE team will look at the existing presence of quick serves to examine the area’s potential receptiveness to their products.
“The performance of our competitors in a given area can often reveal how we might perform in that area,” Lyerly says, acknowledging that the same numbers can also show if a market is oversaturated.
Ultimately, Beery says, development teams should use the Growth 40 to drive on-the-ground site evaluation, where brands can examine visibility, accessibility, and parking, all elements that can have a significant impact on sales regardless of any Growth Index score or competitive landscape.
“The data provides an early mechanism for companies to compare markets with a level of science and apples-to-apples comparison that can … open the door to the future and where more rigorous analytics might be placed,” Beery says. Although further exploration is necessary, he says, “these places are poised for quick-service growth and show some real positives.”


