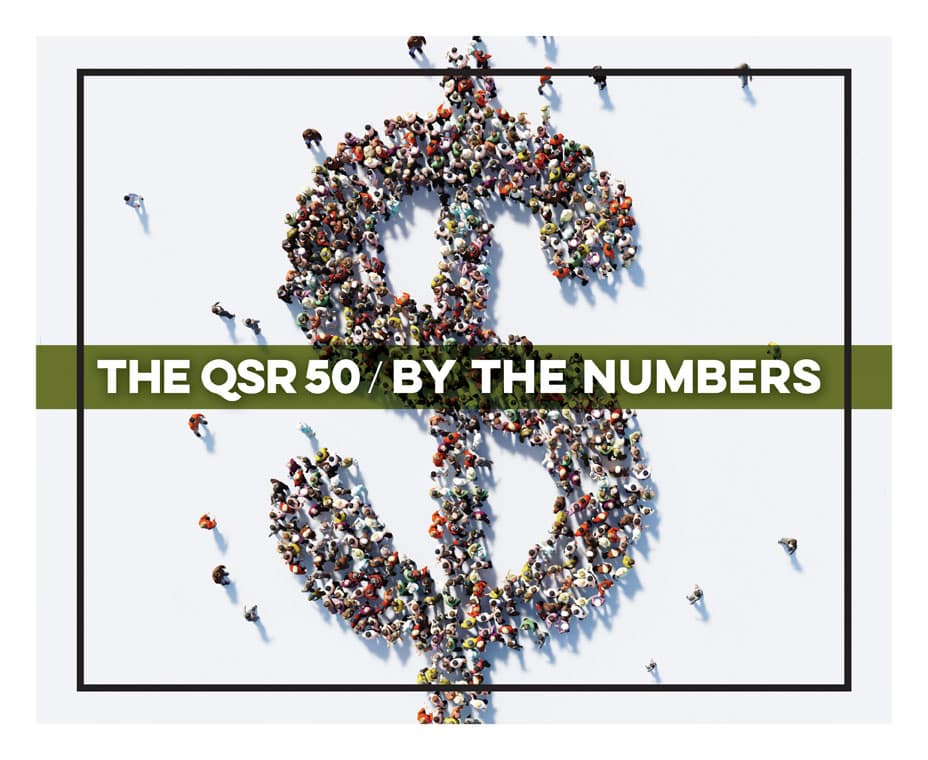
Click column headers to sort
| Category Rank | Overall Rank | Company | 2018 US Sales (Millions) | - | AVG Sales Per Unit (Thousands) | - | Franchise Units | - | Company Units | Total Units | - | Change from 2017 |
|---|---|---|---|---|---|---|---|---|---|---|---|---|
| 1 | 5 | Chick-fil-A* | 10,000.00 | 1 | 4,166.67 | 1 | 2,400 | 2 | 0 | 2,400 | 2 | 175 |
| 2 | 14 | KFC | 4,400.00 | 2 | 1,210.00 | 8 | 4,019 | 1 | 55 | 4,074 | 1 | -35 |
| 3 | 20 | Popeyes* | 3,325.00 | 3 | 1,415.00 | 6 | 2,327 | 3 | 41 | 2,368 | 3 | 148 |
| 4 | 25 | Zaxby's* | 1,850.00 | 4 | 2,060.00 | 3 | 757 | 6 | 141 | 898 | 6 | 21 |
| 5 | 29 | Bojangles' | 1,296.21 | 5 | 1,741.06 | 5 | 440 | 7 | 319 | 759 | 7 | -5 |
| 6 | 30 | Wingstop | 1,261.03 | 6 | 1,139.00 | 9 | 1,095 | 4 | 29 | 1,252 | 4 | 225 |
| 7 | 31 | Raising Cane's* | 1,185.00 | 7 | 2,963.00 | 2 | 70 | 9 | 330 | 400 | 10 | 0 |
| 8 | 35 | El Pollo Loco* | 870.00 | 8 | 1,798.00 | 4 | 271 | 8 | 213 | 484 | 8 | 7 |
| 9 | 42 | Church's Chicken* | 750.00 | 9 | 714.00 | 10 | 811 | 5 | 165 | 1,086 | 5 | -46 |
| 10 | 49 | Boston Market | 557.77 | 10 | 1,259.00 | 7 | 19 | 10 | 435 | 454 | 9 | 7 |
*Includes figures estimated by QSR.