

On Monday, Taco Bell is announcing the expansion of their popular recycling program with TerraCycle to also collect and recycle any brand of sauce dipping cups, souffle cups/lids & coffee creamer pods. To make it official, the program has been renamed the Taco Bell Sauce Container US Recycling Program. “Taco Bell’s category-wide recycling program, along […]
Ben’s Soft Pretzels, the beloved purveyor of warm, doughy delights, is gearing up for a pretzel-filled celebration on National Pretzel Day, which falls on April 26th. As pretzel enthusiasts across the nation mark their calendars, Ben’s Soft Pretzels is rolling out an irresistible offer that combines philanthropy with indulgence. The Deal: Donate and Delight On April 26th, visit […]
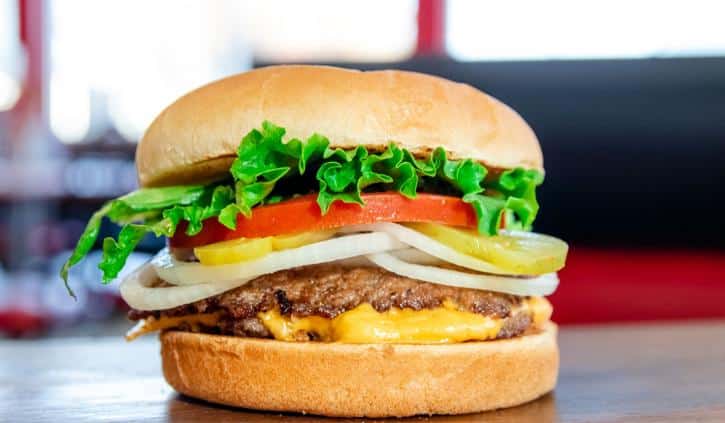
Krystal Restaurants LLC, the original quick-service restaurant chain in the South known for its iconic square sliders, is making it Krystal clear that value is available around the clock. Starting April 22 for a limited time, guests can enjoy the Krystal Meal Deal for $4.99, the 2 for $4.99 breakfast deal and the new Krystal […]

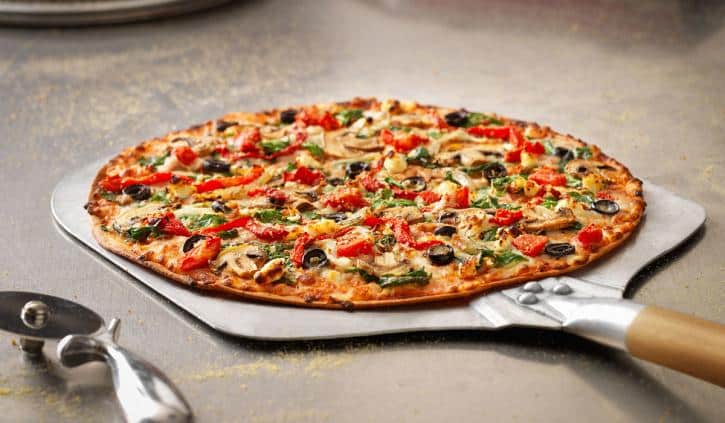
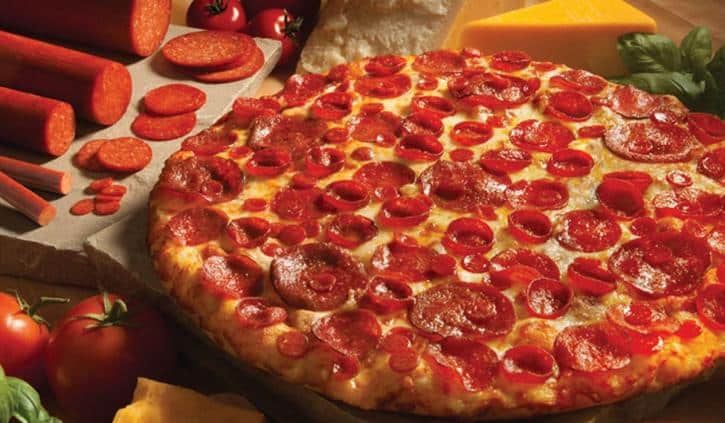
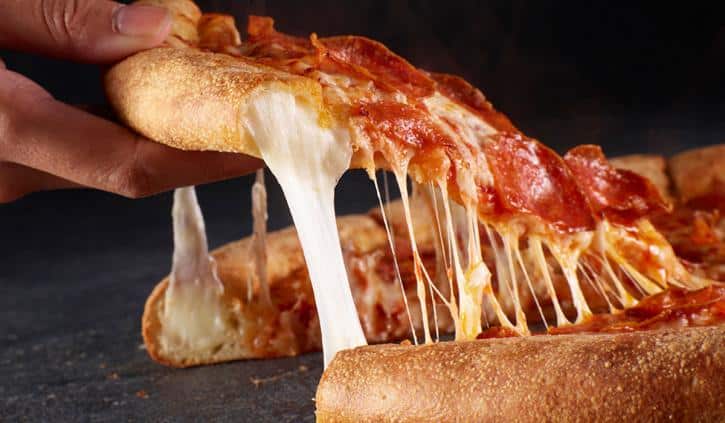
Marco’s Pizza, one of the nation’s fastest-growing pizza brands, announced the launch of a new brand platform, But Wait, There’s Marco’s, designed to disrupt routine ordering behavior and remind consumers of a tastier option – Marco’s Pizza. The opportunity to awaken consumers to the flavorful choice is significant. In fact, 66% of consumers had pizza […]
Roy Rogers Restaurants announced the signing of a lease for its newest location in Leesburg, Virginia. Set to open in late 2025, this eagerly awaited expansion will signify the chain’s third venture in Loudoun County, one of Northern Virginia’s strongest retail, commercial and residential markets. Located within “The Shops at Russell Branch”, a vibrant 62,000 […]
Beef-A-Roo, a Midwest-based restaurant that offers fresh meals at an affordable price, announced the upcoming launch of its newest restaurant in Freeport, Illinois through its innovative modular container location concept. Located at The Meadows Shopping Center on 1810-1876 S. West Ave., the new Beef-A-Roo location will mark a significant advancement in the brand’s franchise expansion strategy. Responsible for […]
Baristas at The Human Bean will begin pouring coffee and other specialty beverages at 2680 Main Street NE beginning Saturday, April 20th. Customers are invited to come get a first taste of the drive-thru’s offerings, including specialty-grade coffee, real-fruit smoothies, whole-leaf teas, and hot breakfast items to-go. Local owner of the new The Human Bean location, Keith […]


Subscribe to A.M. Jolt
"*" indicates required fields