


Life is Good, the original positive lifestyle brand, is teaming up with KFC, the original fried chicken brand, to create a limited-edition capsule collection, available on KFCShop.com and lifeisgood.com starting Thursday. The line will unite the iconic branding of the world-famous chicken chain with Life is Good’s signature uplifting designs, all delivered on the high-quality […]
Toppers Pizza is expanding throughout Wisconsin with a new restaurant at 1602 S. Church Street in Watertown. Opening on Thursday, April 25, the new Toppers is located near the Watertown Municipal Airport next to Cricket Wireless and Great Clips. It’s the first Toppers store owned by franchisees Ahmad Khadeejeh and Mahmoud Rayyan. Toppers will celebrate its Watertown […]
Taco John’s Bigger Bolder Rewards Members get a free beef Taco Bravo with any purchase of $5 or more on May 5. The Taco Bravo elevates the classic Crispy Taco by wrapping it inside a warm flour tortilla layered with soft refried beans. Each Crispy Taco shell is cooked fresh in-house every day, then filled with Taco John’s signature 100% American […]
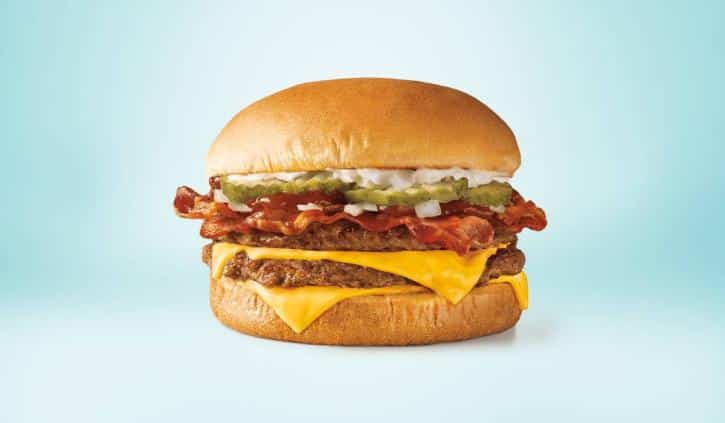
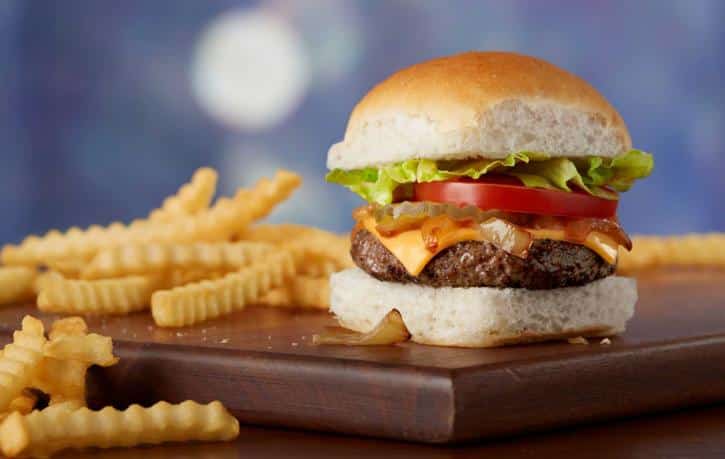
Guests summoned, we answered. Carl’s Jr is giving into guests’ cravings with the infernal return of the devilishly spicy El Diablo burger. Starting today, the cult-favorite menu item, featuring two charbroiled all-beef patties, two strips of bacon, crispy Jalapeño POPPERS Bites, melty pepperjack cheese and fiery habanero ranch sauce on a seeded bun, will rejoin […]
Domino’s brought you Carryout Tips. Now the largest pizza company in the world, known for its value innovation, is launching You Tip, We Tip – a promotion that tips customers who tip their delivery drivers, beginning April 29. “Domino’s drivers have been hustling to deliver hot, delicious pizzas since 1960, and we love that customers […]

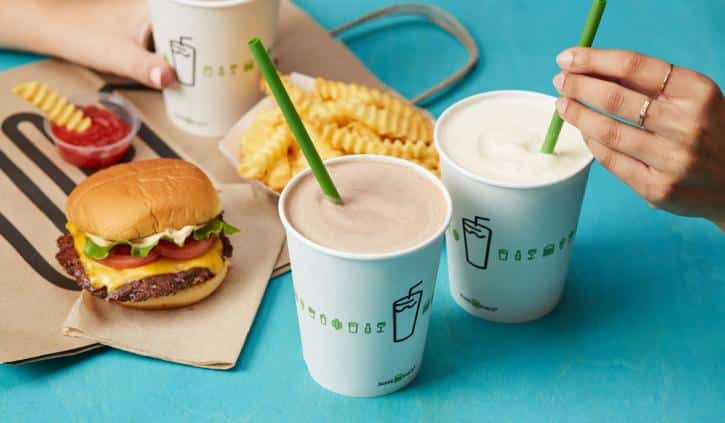
Wienerschnitzel, the world’s largest hot dog concept, announced today a new addition to its executive leadership team, Doug Koob. In this new role, Koob will oversee sales and business development teams for both domestic and international growth, real estate, along with restaurant design and construction. Koob’s background of 40-plus years in the hospitality industry led […]
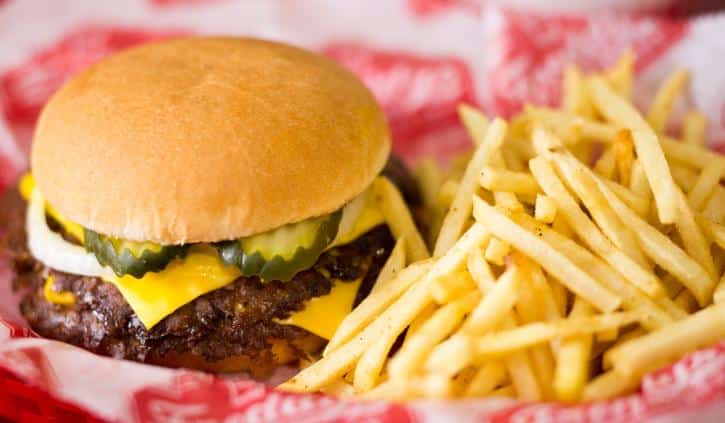
Abbott’s Frozen Custard, the oldest frozen custard franchise in the nation, is celebrating the grand opening of its first franchise location in the state of Texas. Located in the Dallas suburb of McKinney, at 1520 N Hardin Boulevard, it is the first of more than 100 locations throughout Texas to be opened by owner-operator Southern […]

Wendy’s on Tuesday shared progress in sourcing renewable energy through its participation in community solar programs. Emissions reductions from these programs will advance progress against Wendy’s science-based targets to reduce absolute Scope 1 and 2 emissions by 47 percent, and Scope 3 emissions from franchisees by 47 percent per restaurant by 2030, both from a […]
Subscribe to A.M. Jolt
"*" indicates required fields