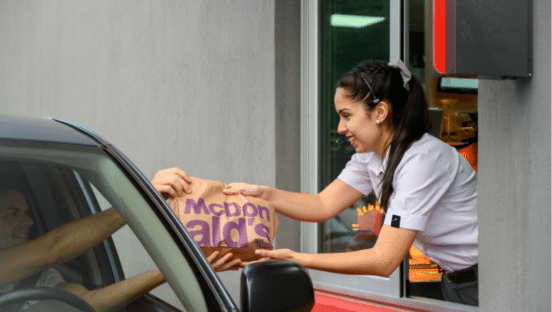






















Year 1 of COVID-19 was defined by divergent realities. Quick-service outlets fared far better than competitors. Once the initial wave of uncertainty passed (was it even safe to get food at the drive-thru?), the sector’s long-standing strength outside its four walls crystalized. Not only that, however, but the agility and innovation that’s always defined the category.
And now? You could argue quick service, especially drive-thru, has become the hottest retail ticket in town. As this year’s QSR 50 shows, many concepts aren’t recalibrating in the wake of the pandemic; they’re rocketing upward. Major growth prospects—at times in the four-digit realm—are on the table for fast casuals and fast-food icons alike.
But the coast isn’t free of obstacles. This past year provided frequent hurdles, from Omicron to a continued labor battle that’s stretching well past the crisis. Buzzing topics like robotics, AI, automation, and integration, have popped up in response and handed operators more threads to connect with guests than ever.
And in the end, we might just be headed for a golden era of quick-service growth unlike anything we’ve seen in decades.
Here is a look at this year’s top 50 quick-service brands in America, ranked by total U.S. systemwide sales.
Click here for a free download of the entire QSR 50 and brand-by-brand breakdown.
Note: If viewing on desktop, please click the arrow in the picture to continue. * Indicates estimate by QSR.
1. McDonald’s
U.S. systemwide sales (millions): $45,960
Average sales per unit (thousands): $3,420
Franchised stores: 12,775
Company stores: 663
2021 Total Units: 13,438
Total change in units from 2020: –244
Click here for a free download of the entire QSR 50 and brand-by-brand breakdown.
2. Starbucks*
U.S. systemwide sales (millions): $24,300
Average sales per unit (thousands): $1,200
Franchised stores: 6,497
Company stores: 8,953
2021 Total Units: 15,450
Total change in units from 2020: 113
Click here for a free download of the entire QSR 50 and brand-by-brand breakdown.
3. Chick-fil-A*
U.S. systemwide sales (millions): $16,700
Average sales per unit (thousands): $6,100
Franchised stores: 2,650
Company stores: 82
2021 Total Units: 2,732
Total change in units from 2020: 155
Click here for a free download of the entire QSR 50 and brand-by-brand breakdown.
4. Taco Bell
U.S. systemwide sales (millions): $12,600
Average sales per unit (thousands): $1,823
Franchised stores: 6,540
Company stores: 462
2021 Total Units: 7,002
Total change in units from 2020: 203
Click here for a free download of the entire QSR 50 and brand-by-brand breakdown.
5. Wendy’s
U.S. systemwide sales (millions): $11,111
Average sales per unit (thousands): $1,895
Franchised stores: 5,535
Company stores: 403
2021 Total Units: 5,938
Total change in units from 2020: 57
Click here for a free download of the entire QSR 50 and brand-by-brand breakdown.
6. Dunkin’
U.S. systemwide sales (millions): $10,416
Average sales per unit (thousands): $1,127
Franchised stores: 9,244
Company stores: 0
2021 Total Units: 9,244
Total change in units from 2020: 161
Click here for a free download of the entire QSR 50 and brand-by-brand breakdown.
7. Burger King
U.S. systemwide sales (millions): $10,033
Average sales per unit (thousands): $1,470
Franchised stores: 7,054
Company stores: 51
2021 Total Units: 7,105
Total change in units from 2020: 24
Click here for a free download of the entire QSR 50 and brand-by-brand breakdown.
8. Subway*
U.S. systemwide sales (millions): $9,350
Average sales per unit (thousands): $438
Franchised stores: 21,147
Company stores: 0
2021 Total Units: 21,147
Total change in units from 2020: -1,043
Click here for a free download of the entire QSR 50 and brand-by-brand breakdown.
9. Domino’s
U.S. systemwide sales (millions): $8,641
Average sales per unit (thousands): $1,317
Franchised stores: 6,185
Company stores: 375
2021 Total Units: 6,560
Total change in units from 2020: 205
Click here for a free download of the entire QSR 50 and brand-by-brand breakdown.
10. Chipotle
U.S. systemwide sales (millions): $7,547
Average sales per unit (thousands): $2,641
Franchised stores: 0
Company stores: 2,966
2021 Total Units: 2,966
Total change in units from 2020: 198
Click here for a free download of the entire QSR 50 and brand-by-brand breakdown.
11. Sonic Drive-In
U.S. systemwide sales (millions): $5,835
Average sales per unit (thousands): $1,643
Franchised stores: 3,232
Company stores: 320
2021 Total Units: 3,552
Total change in units from 2020: 26
Click here for a free download of the entire QSR 50 and brand-by-brand breakdown.
12. Panera Bread*
U.S. systemwide sales (millions): $5,650
Average sales per unit (thousands): $2,700
Franchised stores: 1,130
Company stores: 950
2021 Total Units: 2,080
Total change in units from 2020: -25
Click here for a free download of the entire QSR 50 and brand-by-brand breakdown.
13. Pizza Hut
U.S. systemwide sales (millions): $5,500
Average sales per unit (thousands): $1,022
Franchised stores: 6,526
Company stores: 22
2021 Total Units: 6,548
Total change in units from 2020: -13
Click here for a free download of the entire QSR 50 and brand-by-brand breakdown.
14. KFC
U.S. systemwide sales (millions): $5,100
Average sales per unit (thousands): $1,408
Franchised stores: 3,906
Company stores: 47
2021 Total Units: 3,953
Total change in units from 2020: 10
Click here for a free download of the entire QSR 50 and brand-by-brand breakdown.
15. Popeyes Louisiana Kitchen
U.S. systemwide sales (millions): $4,775
Average sales per unit (thousands): $1,867
Franchised stores: 2,716
Company stores: 41
2021 Total Units: 2,754
Total change in units from 2020: 146
Click here for a free download of the entire QSR 50 and brand-by-brand breakdown.
16. Dairy Queen
U.S. systemwide sales (millions): $4,494
Average sales per unit (thousands): $1,036
Franchised stores: 4,337
Company stores: 2
2021 Total Units: 4,339
Total change in units from 2020: -22
Click here for a free download of the entire QSR 50 and brand-by-brand breakdown.
17. Arby’s
U.S. systemwide sales (millions): $4,462
Average sales per unit (thousands): $1,309
Franchised stores: 2,293
Company stores: 1,116
2021 Total Units: 3,409
Total change in units from 2020: 40
Click here for a free download of the entire QSR 50 and brand-by-brand breakdown.
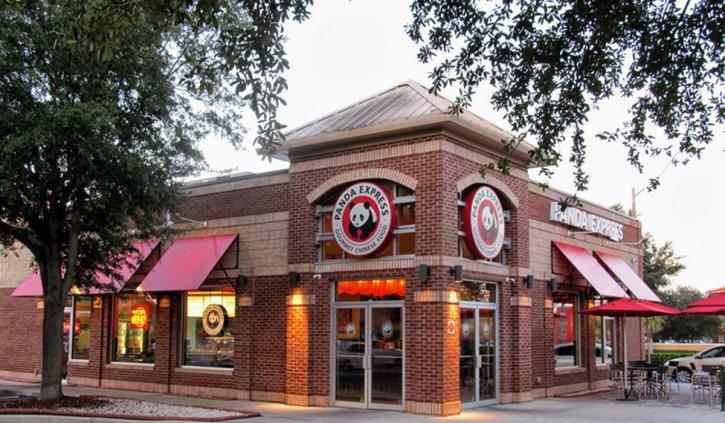
18. Panda Express
U.S. systemwide sales (millions): $4,452
Average sales per unit (thousands): $2,173
Franchised stores: 147
Company stores: 2,187
2021 Total Units: 2,334
Total change in units from 2020: 150
Click here for a free download of the entire QSR 50 and brand-by-brand breakdown.
19. Little Caesars*
U.S. systemwide sales (millions): $4,185
Average sales per unit (thousands): $1,000
Franchised stores: 3,601
Company stores: 580
2021 Total Units: 4,181
Total change in units from 2020: -28
Click here for a free download of the entire QSR 50 and brand-by-brand breakdown.
20. Jack in the Box
U.S. systemwide sales (millions): $4,077
Average sales per unit (thousands): $1,843
Franchised stores: 2,055
Company stores: 163
2021 Total Units: 2,218
Total change in units from 2020: -23
Click here for a free download of the entire QSR 50 and brand-by-brand breakdown.
21. Papa Johns
U.S. systemwide sales (millions): $3,486
Average sales per unit (thousands): $1,147
Franchised stores: 2,564
Company stores: 600
2021 Total Units: 3,164
Total change in units from 2020: 30
Click here for a free download of the entire QSR 50 and brand-by-brand breakdown.
22. Whataburger
U.S. systemwide sales (millions): $3,089
Average sales per unit (thousands): $3,640
Franchised stores: 131
Company stores: 742
2021 Total Units: 873
Total change in units from 2020: 29
Click here for a free download of the entire QSR 50 and brand-by-brand breakdown.
23. Culver’s
U.S. systemwide sales (millions): $2,489
Average sales per unit (thousands): $3,099
Franchised stores: 831
Company stores: 6
2021 Total Units: 837
Total change in units from 2020: 55
Click here for a free download of the entire QSR 50 and brand-by-brand breakdown.
24. Raising Cane’s
U.S. systemwide sales (millions): $2,377
Average sales per unit (thousands): $4,893
Franchised stores: 23
Company stores: 544
2021 Total Units: 567
Total change in units from 2020: 58
Click here for a free download of the entire QSR 50 and brand-by-brand breakdown.
25. Jimmy John’s
U.S. systemwide sales (millions): $2,301
Average sales per unit (thousands): $866
Franchised stores: 2,616
Company stores: 41
2021 Total Units: 2,657
Total change in units from 2020: 48
Click here for a free download of the entire QSR 50 and brand-by-brand breakdown.
26. Wingstop*
U.S. systemwide sales (millions): $2,278
Average sales per unit (thousands): $1,592
Franchised stores: 1,498
Company stores: 36
2021 Total Units: 1,534
Total change in units from 2020: 175
Click here for a free download of the entire QSR 50 and brand-by-brand breakdown.
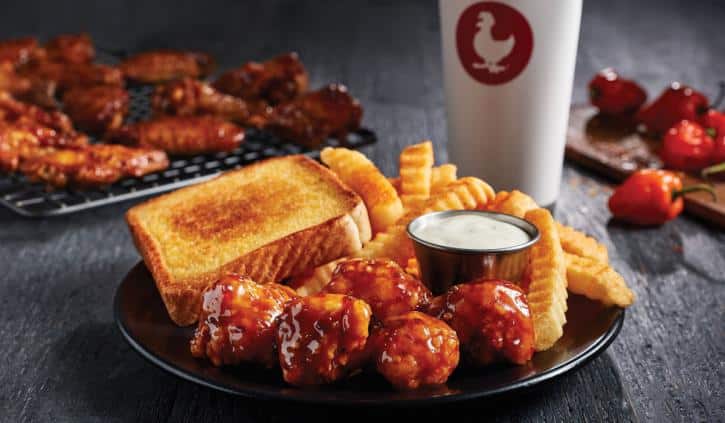
27. Zaxby’s
U.S. systemwide sales (millions): $2,233
Average sales per unit (thousands): $2,484
Franchised stores: 761
Company stores: 147
2021 Total Units: 908
Total change in units from 2020: 3
Click here for a free download of the entire QSR 50 and brand-by-brand breakdown.
28. Jersey Mike’s
U.S. systemwide sales (millions): $2,203
Average sales per unit (thousands): $1,145
Franchised stores: 2,087
Company stores: 13
2021 Total Units: 2,100
Total change in units from 2020: 246
Click here for a free download of the entire QSR 50 and brand-by-brand breakdown.
29. Hardee’s*
U.S. systemwide sales (millions): $2,100
Average sales per unit (thousands): $1,117
Franchised stores: 1,536
Company stores: 198
2021 Total Units: 1,734
Total change in units from 2020: -32
Click here for a free download of the entire QSR 50 and brand-by-brand breakdown.
30. Five Guys
U.S. systemwide sales (millions): $2,093
Average sales per unit (thousands): $3,172
Franchised stores: 911
Company stores: 479
2021 Total Units: 1,390
Total change in units from 2020: 8
Click here for a free download of the entire QSR 50 and brand-by-brand breakdown.
31. Carl’s Jr.*
U.S. systemwide sales (millions): $1,560
Average sales per unit (thousands): $1,400
Franchised stores: 1,011
Company stores: 47
2021 Total Units: 1,058
Total change in units from 2020: -21
Click here for a free download of the entire QSR 50 and brand-by-brand breakdown.
32. Bojangles
U.S. systemwide sales (millions): $1,485
Average sales per unit (thousands): $1,924
Franchised stores: 496
Company stores: 277
2021 Total Units: 773
Total change in units from 2020: 15
Click here for a free download of the entire QSR 50 and brand-by-brand breakdown.
33. In-N-Out Burger*
U.S. systemwide sales (millions): $1,175
Average sales per unit (thousands): $3,200
Franchised stores: 0
Company stores: 370
2021 Total Units: 370
Total change in units from 2020: 5
Click here for a free download of the entire QSR 50 and brand-by-brand breakdown.
34. Firehouse Subs
U.S. systemwide sales (millions): $1,044
Average sales per unit (thousands): $909
Franchised stores: 1,101
Company stores: 39
2021 Total Units: 1,140
Total change in units from 2020: 9
Click here for a free download of the entire QSR 50 and brand-by-brand breakdown.
35. Krispy Kreme*
U.S. systemwide sales (millions): $996
Average sales per unit (thousands): $4,000
Franchised stores: 51
Company stores: 307
2021 Total Units: 358
Total change in units from 2020: 6
Click here for a free download of the entire QSR 50 and brand-by-brand breakdown.
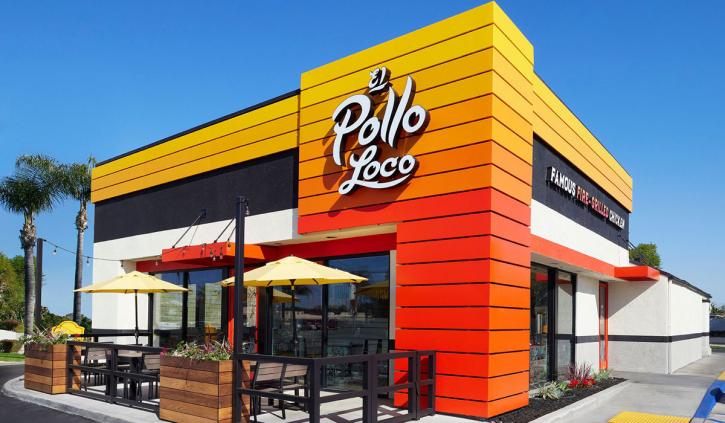
36. El Pollo Loco
U.S. systemwide sales (millions): $973
Average sales per unit (thousands): $2,000
Franchised stores: 292
Company stores: 189
2021 Total Units: 481
Total change in units from 2020: 1
Click here for a free download of the entire QSR 50 and brand-by-brand breakdown.
37. Tropical Smoothie Cafe
U.S. systemwide sales (millions): $948
Average sales per unit (thousands): $1,009
Franchised stores: 1,038
Company stores: 1
2021 Total Units: 1,039
Total change in units from 2020: 125
Click here for a free download of the entire QSR 50 and brand-by-brand breakdown.
38. Del Taco*
U.S. systemwide sales (millions): $931
Average sales per unit (thousands): $1,551
Franchised stores: 306
Company stores: 294
2021 Total Units: 600
Total change in units from 2020: 4
Click here for a free download of the entire QSR 50 and brand-by-brand breakdown.
39. Checkers/Rally’s
U.S. systemwide sales (millions): $931
Average sales per unit (thousands): $1,145
Franchised stores: 568
Company stores: 266
2021 Total Units: 834
Total change in units from 2020: -13
Click here for a free download of the entire QSR 50 and brand-by-brand breakdown.
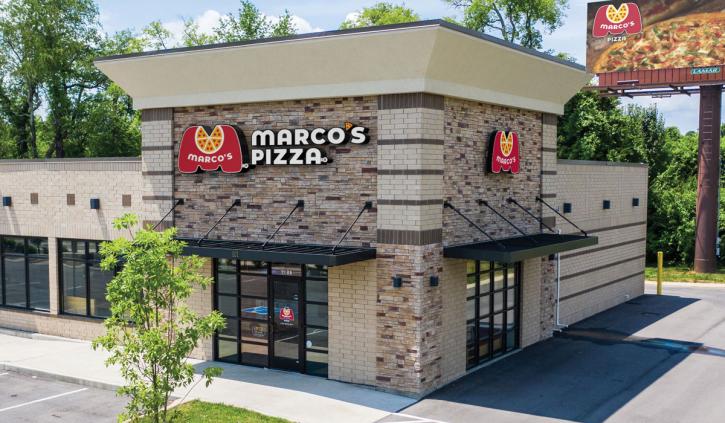
40. Marco’s Pizza
U.S. systemwide sales (millions): $899
Average sales per unit (thousands): $934
Franchised stores: 957
Company stores: 45
2021 Total Units: 1,002
Total change in units from 2020: 48
Click here for a free download of the entire QSR 50 and brand-by-brand breakdown.
41. McAlister’s Deli
U.S. systemwide sales (millions): $869
Average sales per unit (thousands): $1,866
Franchised stores: 472
Company stores: 33
2021 Total Units: 505
Total change in units from 2020: 24
Click here for a free download of the entire QSR 50 and brand-by-brand breakdown.
42. QDOBA*
U.S. systemwide sales (millions): $835
Average sales per unit (thousands): $1,006
Franchised stores: 406
Company stores: 333
2021 Total Units: 739
Total change in units from 2020: -2
Click here for a free download of the entire QSR 50 and brand-by-brand breakdown.
43. Papa Murphy’s
U.S. systemwide sales (millions): $809
Average sales per unit (thousands): $643
Franchised stores: 1,213
Company stores: 27
2021 Total Units: 1,240
Total change in units from 2020: -53
Click here for a free download of the entire QSR 50 and brand-by-brand breakdown.
44. Shake Shack*
U.S. systemwide sales (millions): $777
Average sales per unit (thousands): $3,679
Franchised stores: 25
Company stores: 218
2021 Total Units: 243
Total change in units from 2020: 38
Click here for a free download of the entire QSR 50 and brand-by-brand breakdown.
45. Church’s Chicken
U.S. systemwide sales (millions): $776
Average sales per unit (thousands): $870
Franchised stores: 731
Company stores: 161
2021 Total Units: 892
Total change in units from 2020: -13
Click here for a free download of the entire QSR 50 and brand-by-brand breakdown.
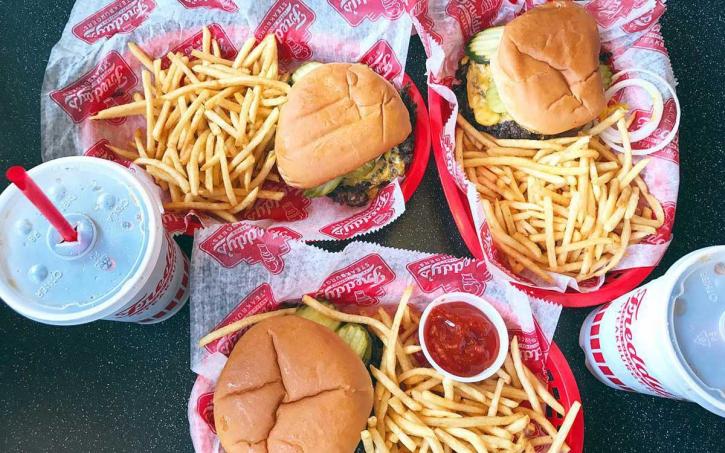
46. Freddy’s Frozen Custard & Steakburgers
U.S. systemwide sales (millions): $759
Average sales per unit (thousands): $1,842
Franchised stores: 391
Company stores: 29
2021 Total Units: 420
Total change in units from 2020: 32
Click here for a free download of the entire QSR 50 and brand-by-brand breakdown.
47. Tim Hortons
U.S. systemwide sales (millions): $687
Average sales per unit (thousands): $1,200
Franchised stores: 637
Company stores: 0
2021 Total Units: 637
Total change in units from 2020: 4
Click here for a free download of the entire QSR 50 and brand-by-brand breakdown.
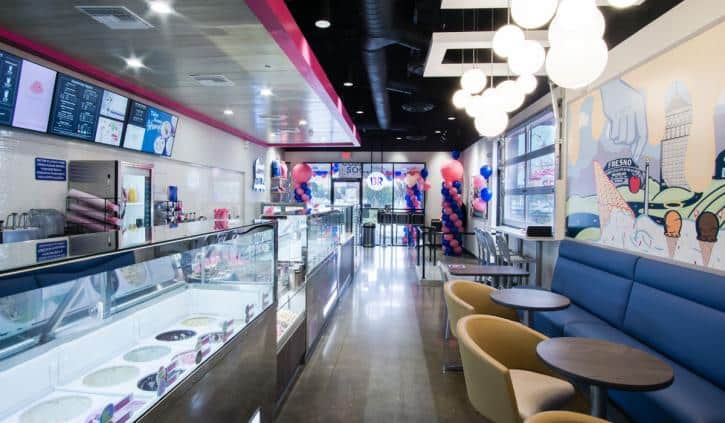
48. Baskin-Robbins
U.S. systemwide sales (millions): $686
Average sales per unit (thousands): $296
Franchised stores: 2,317
Company stores: 0
2021 Total Units: 2,317
Total change in units from 2020: 102
Click here for a free download of the entire QSR 50 and brand-by-brand breakdown.
49. Moe’s Southwest Grill
U.S. systemwide sales (millions): $661
Average sales per unit (thousands): $1,073
Franchised stores: 658
Company stores: 1
2021 Total Units: 659
Total change in units from 2020: -22
Click here for a free download of the entire QSR 50 and brand-by-brand breakdown.
50. White Castle
U.S. systemwide sales (millions): $615
Average sales per unit (thousands): $1,749
Franchised stores: 0
Company stores: 349
2021 Total Units: 349
Total change in units from 2020: -6
Click here for a free download of the entire QSR 50 and brand-by-brand breakdown.
Methodology:
The QSR 50 is an annual ranking of limited-service restaurant companies by U.S. system-wide sales. QSR magazine collected information directly from restaurant companies from March to May 2022, and also partnered with FoodserviceResults, a research and consulting firm specializing in consumer research, data analysis, and insights to the foodservice industry. FoodserviceResults and QSR requested confirmation of U.S. sales, units, and average-unit volume from all leading chain restaurant corporate headquarters. Filings from the Securities and Exchange Commission (sec), Franchise Disclosure Documents (fdd), transactional data, and statistics from other sources were amalgamated, reviewed, and analyzed to yield domestic sales, unit count, and average-unit volume. When necessary, estimates were made in order to more accurately report on restaurant industry leaders. All information reflects 2021 fiscal performance. Founded by industry veteran Darren Tristano, FoodserviceResults specializes in consumer research, data analysis, and insights to the foodservice industry.

