
Following the growth path
COVID effectively slammed the restaurant industry, but six months into the pandemic, brands are well on their way toward recovery. Some skipped that stage and entered record-breaking territory, like Papa John’s.
Now the question becomes, which restaurants are in a position to expand in a post-COVID world where real estate opportunities will rise in the wake of widespread closures? The QSR 50, a collection of data from the top-50 grossing quick-service restaurants, provides insight into the concepts best capitalized to emerge.
CHECK OUT PAST RESULTS:
This slideshow takes a look at the brands that carried the most momentum into 2020 in terms of unit growth.
Note: The unit counts are by U.S. restaurants as of 2019 year end and the fastest-growing list is picked from among the top 50 grossing quick-service chains in terms of total systemwide sales.
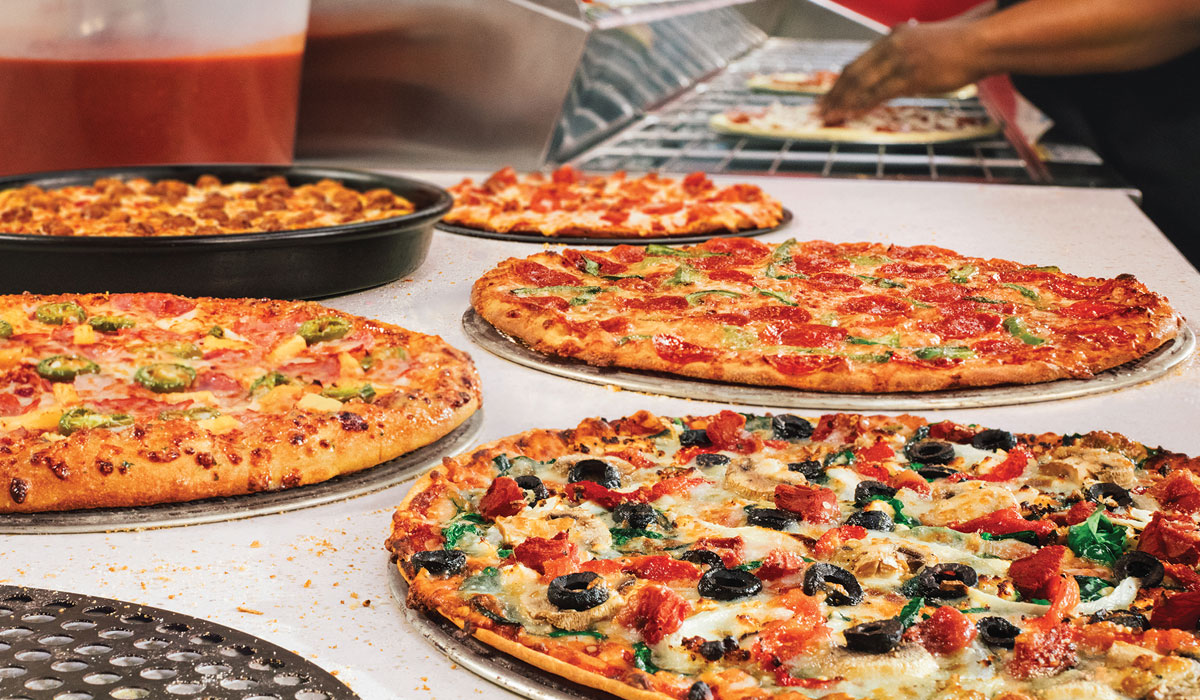
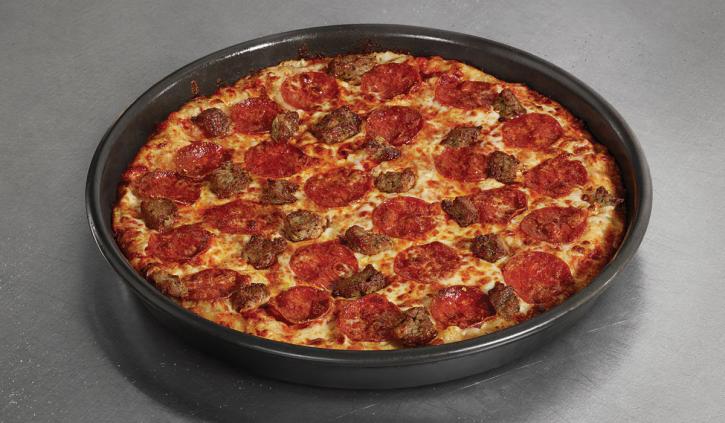
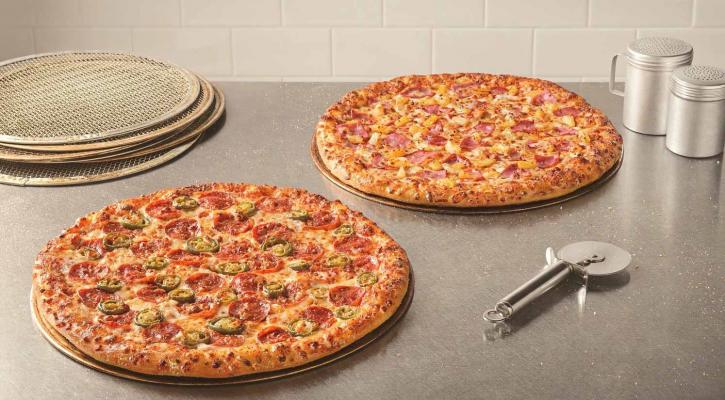
Domino’s
Total change in units from 2018: 253
Unit count: 6,157
Franchised stores: 5,815
Company stores: 342
U.S. systemwide sales (millions): $7,100
Average sales per unit (thousands): $1,178
Starbucks
Total change in units from 2018: 216
Unit count: 15,041
Franchised stores: 6,768
Company stores: 8,273
U.S. systemwide sales (millions): $21,550
Average sales per unit (thousands): $1,454
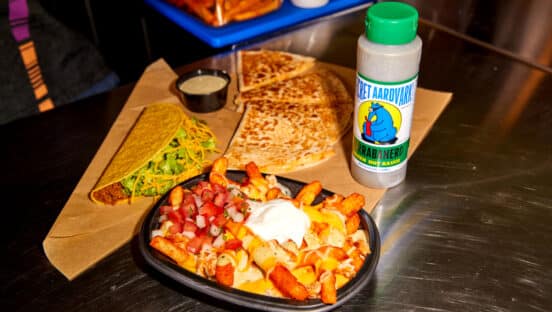
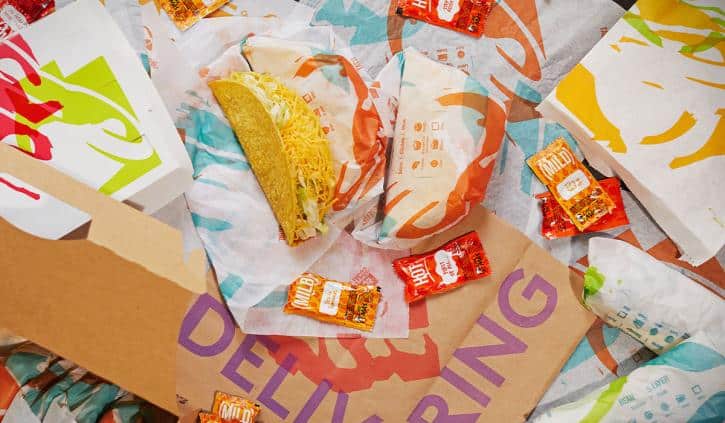
Taco Bell
Total change in units from 2018: 181
Unit count: 7,089
Franchised stores: 6,622
Company stores: 467
U.S. systemwide sales (millions): $11,000
Average sales per unit (thousands): $1,502
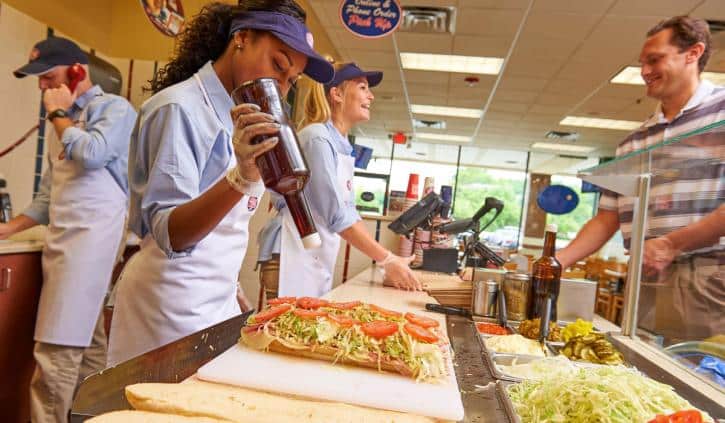
Jersey Mike’s
Total change in units from 2018: 173
Unit count: 1,667
Franchised stores: 1,595
Company stores: 72
U.S. systemwide sales (millions): $1,340
Average sales per unit (thousands): $824
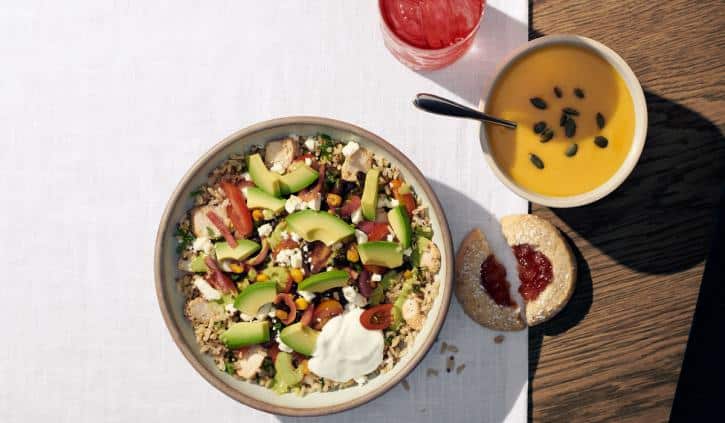
Panera Bread
Total change in units from 2018: 132
Unit count: 2,225
Franchised stores: 1,202
Company stores: 1,023
U.S. systemwide sales (millions): $5,925
Average sales per unit (thousands): $2,751
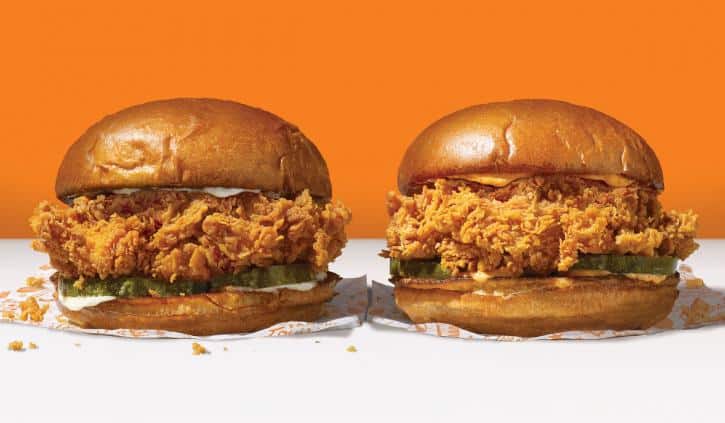
Popeyes Louisiana Kitchen
Total change in units from 2018: 131
Unit count: 2,499
Franchised stores: 2,458
Company stores: 41
U.S. systemwide sales (millions): $3,750
Average sales per unit (thousands): $1,541
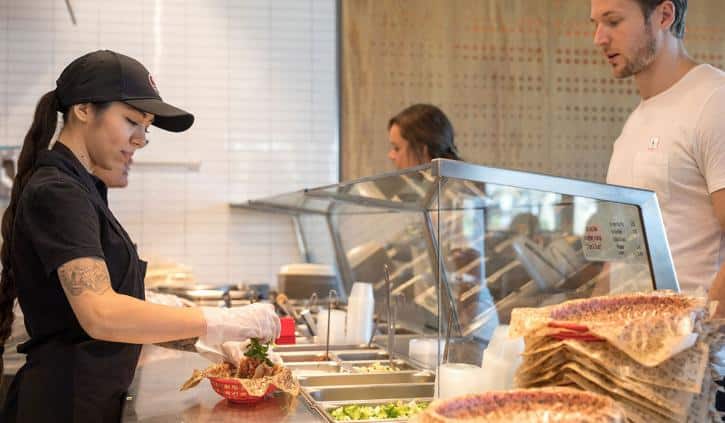
Chipotle
Total change in units from 2018: 130
Unit count: 2,580
Franchised stores: 0
Company stores: 2,580
U.S. systemwide sales (millions): $5,520
Average sales per unit (thousands): $2,195
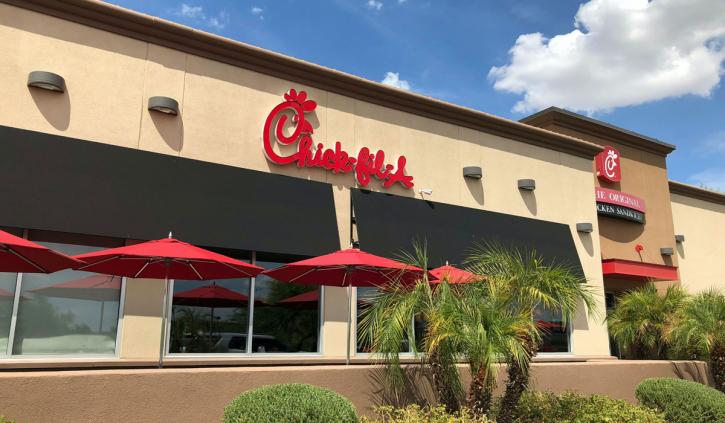
Chick-fil-A
Total change in units from 2018: 130
Unit count: 2,500
Franchised stores: 2,500
Company stores: 0
U.S. systemwide sales (millions): $11,000
Average sales per unit (thousands): $4,517
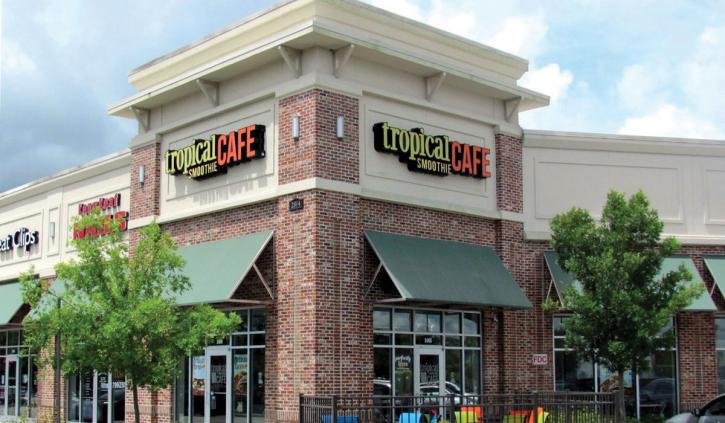
Tropical Smoothie Cafe
Total change in units from 2018: 115
Unit count: 834
Franchised stores: 833
Company stores: 1
U.S. systemwide sales (millions): $577
Average sales per unit (thousands): $769
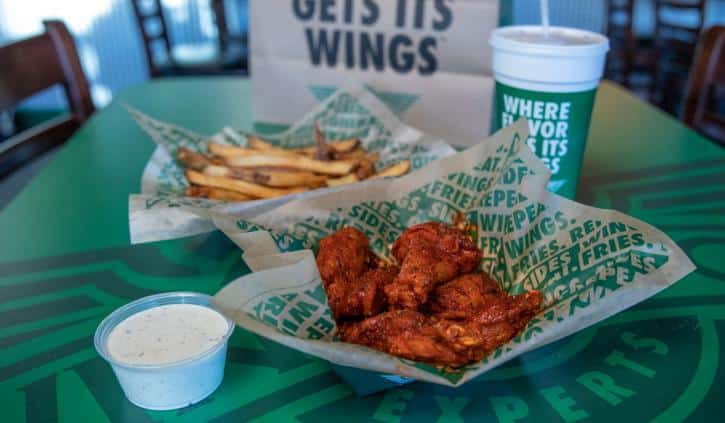
Wingstop
Total change in units from 2018: 107
Unit count: 1,231
Franchised stores: 1,200
Company stores: 31
U.S. systemwide sales (millions): $1,400
Average sales per unit (thousands): $1,250
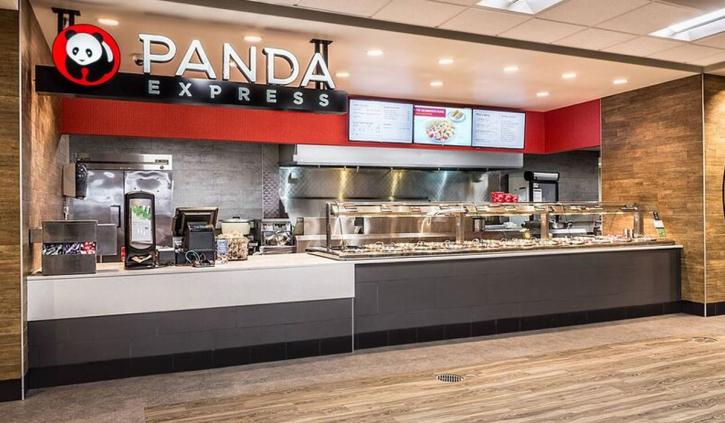
Panda Express
Total change in units from 2018: 80
Unit count: 2,184
Franchised stores: 138
Company stores: 2,046
U.S. systemwide sales (millions): $3,800
Average sales per unit (thousands): $1,765
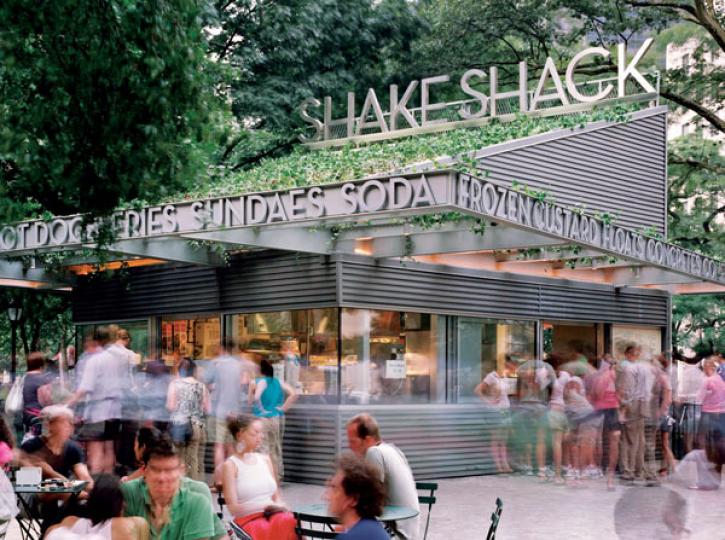
Shake Shack
Total change in units from 2018: 59
Unit count: 185
Franchised stores: 22
Company stores: 163
U.S. systemwide sales (millions): $630
Average sales per unit (thousands): $4,214
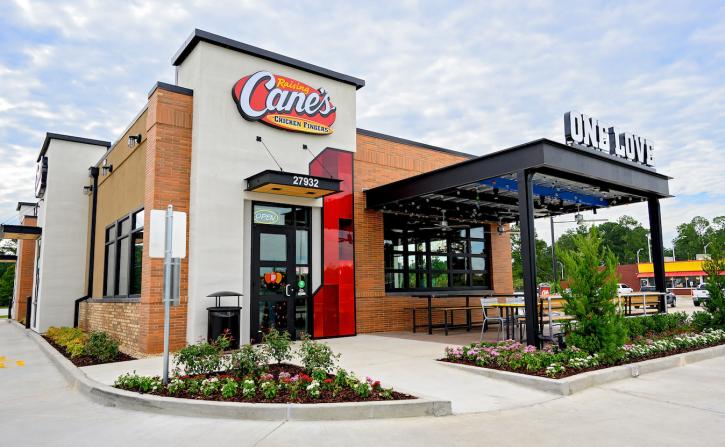
Raising Cane’s
Total change in units from 2018: 57
Unit count: 457
Franchised stores: 86
Company stores: 371
U.S. systemwide sales (millions): $1,466
Average sales per unit (thousands): $3,600
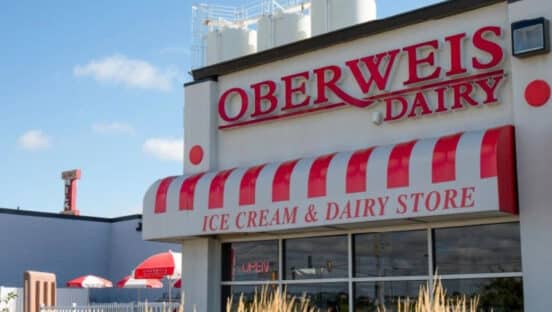
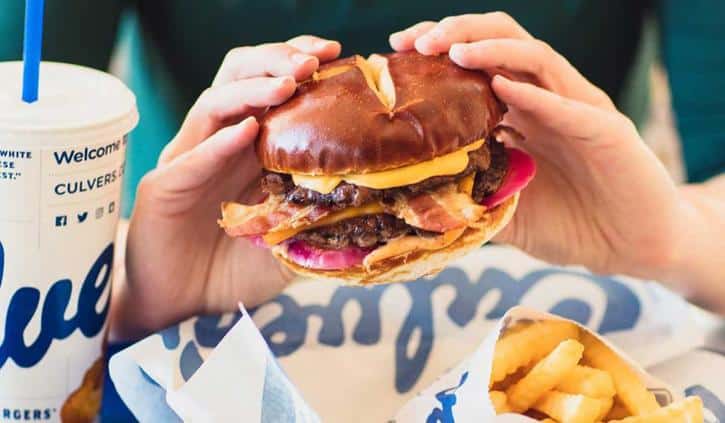
Culver’s
Total change in units from 2018: 46
Unit count: 733
Franchised stores: 727
Company stores: 6
U.S. systemwide sales (millions): $1,730
Average sales per unit (thousands): $2,435
Dunkin’
Total change in units from 2018: 42
Unit count: 9,630
Franchised stores: 9,630
Company stores: 0
U.S. systemwide sales (millions): $9,220
Average sales per unit (thousands): $968
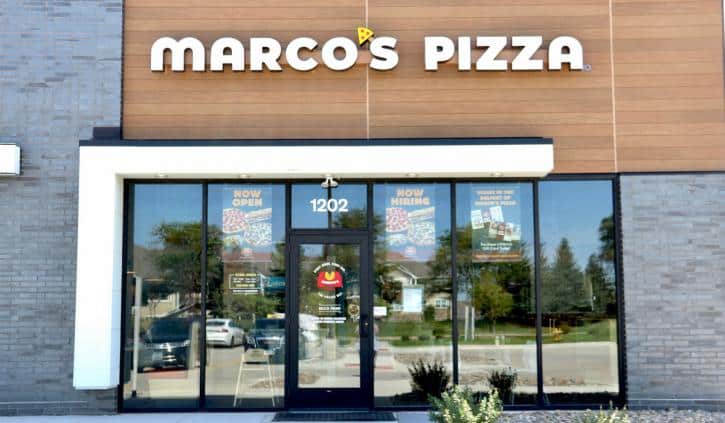
Marco’s Pizza
Total change in units from 2018: 32
Unit count: 915
Franchised stores: 875
Company stores: 40
U.S. systemwide sales (millions): $628
Average sales per unit (thousands): $726
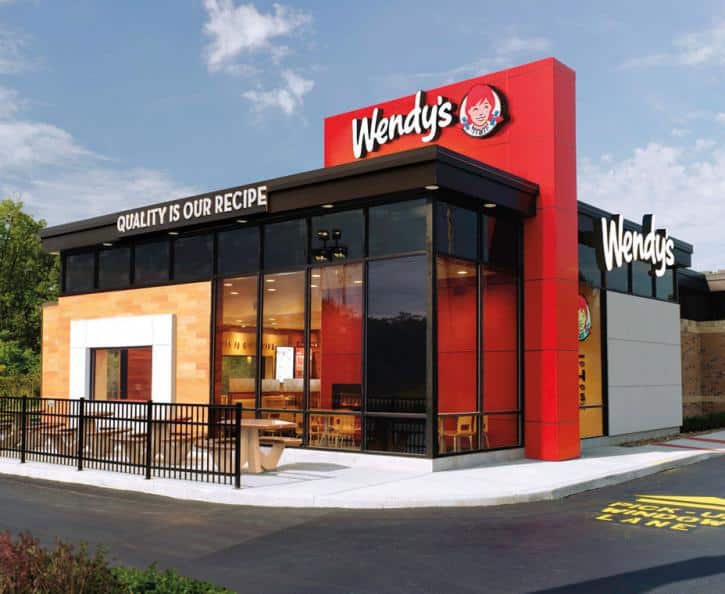
Wendy’s
Total change in units from 2018: 30
Unit count: 5,852
Franchised stores: 5,495
Company stores: 357
U.S. systemwide sales (millions): $9,865
Average sales per unit (thousands): $1,666
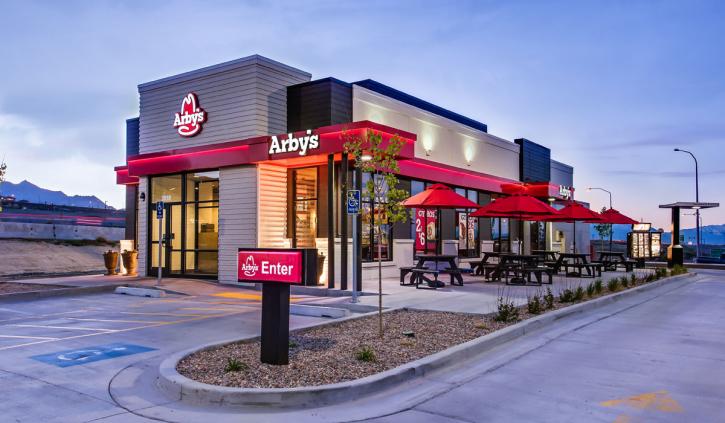
Arby’s
Total change in units from 2018: 30
Unit count: 3,359
Franchised stores: 2,170
Company stores: 1,189
U.S. systemwide sales (millions): $3,885
Average sales per unit (thousands): $1,183
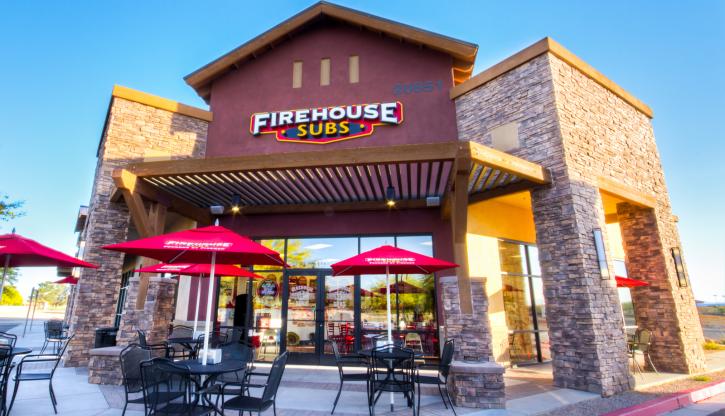
Firehouse Subs
Total change in units from 2018: 24
Unit count: 1,153
Franchised stores: 1,115
Company stores: 38
U.S. systemwide sales (millions): $855
Average sales per unit (thousands): $729

