Another year, another Chick-fil-A victory. But how narrow is the chicken gap? In the latest edition of Market Force Information’s large-scale study, which polls more than 7,600 consumers, the category juggernaut once again reigned. And not just atop chicken competitors, but the entire industry. The brand’s Composite Loyalty Index of 79 bested all brands, broken down by chicken, sandwich, burger, Mexican, pizza, coffee and bakery, and frozen dessert and smoothie restaurants.
For the rankings, Market Force asked participants to rate their satisfaction with their most recent quick-service restaurant experience, and their likelihood to refer that restaurant to others. The results were averaged to attain the score.
READ MORE:
See where the brands ranked in last year’s study.
The study also revealed some insights into the dining landscape and what customers are looking for, as well as what they give specific chains credit for and what they don’t.
“Our research found that, on average, one in seven guests had a disappointing experience at the [quick-service] brand they most recently visited, and few disappointed guests actually reported their dissatisfaction to the restaurant,” says Brad Christian, chief customer officer at Market Force Information. “Due to the array of offers available today, the industry has become a ‘one strike and you’re out’ environment. This leaves brands vulnerable to negative comments online and customer attrition. In order to be truly competitive and drive same store sales growth in a landscape with so many choices, [quick-serve] brands must strive to delight, not just satisfy guests; to deliver against all of the customer experience attributes that drive satisfaction—not just food quality and value, but also service speed, cleanliness, friendliness and others.”
Let’s take a deep dive into the chicken category. Firstly, Chick-fil-A has fronted this pool for five straight years in Market Force’s study. Yet it’s running neck and neck overall with Raising Cane’s, which came in second at 78 percent.
See below.

As the following chart shows, Chick-fil-A sat atop seven of the eight measures. Raising Cane’s won the other—atmosphere, and by four percentage points. The largest separation for Chick-fil-A came at staff friendliness, where it scored 82 percent to Raising Cane’s 71. That’s the golden egg Chick-fil-A has carried since day one. Raising Cane’s was also well behind in health options at 55 to 36 percent, with El Pollo Loco slotting in at No. 2 (54 percent). Otherwise, Chick-fil-A and Raising Cane’s ran No. 1 and No. 2 across every measure.

Market Force used its data to take the pulse of the chicken segment overall. It uncovered some intriguing points.
Dining frequency for chicken restaurants compared similarly to last year, with only one in 10 visits identifying as frequent guests. Sixty-one percent of respondents said they visit once a month or less; 21 percent said two times; 17 percent three times; 10 percent four times; 9 percent five times; 6 percent six times; 2 percent seven times; 2 percent eight times; 1 percent nine times; and 9 percent 10 or more times.
Market Force found that guests in the chicken category use drive thru or dine-in more often, and that delivery is still rarely used.
- 39 percent: drive thru
- 35 percent: dine in
- 25 percent: take out directly from the restaurant
- 2 percent: delivery directly by the restaurant or third party.
Also, 95 percent of the dine-in guests said they ordered at the counter. Only 4 percent ordered ahead with an app or digital platform. Two percent used a device at the table and less than 1 percent a kiosk.
And while the chicken category wasn’t heavily weighted by frequent users, it didn’t have high trial necessarily, either. Just 3 percent of people said this was the first time they’ve visited the particular restaurant brand. The reason for that isn’t overly complex. Many of these chicken chains are established. They’re not exactly upstarts.
Primary trial reason:
- Just driving or walking by the restaurant: 39 percent
- Recommendation from a friend or family member: 31 percent
- A specific promotion or voucher: 16 percent
- A review that I read online: 5 percent
- A billboard advertisement: 3 percent
- A TV or radio advertisement: 3 percent
- A print advertisement in a newspaper or magazine: 1 percent
- A review that I read in print media: 1 percent
- An online advertisement: 1 percent
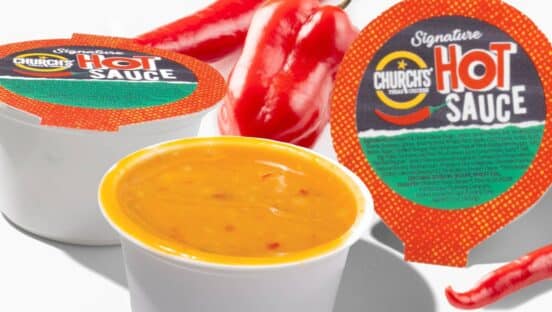
Church’s Chicken and Raising Cane’s received the most new trials.
- Church’s: 7 percent
- Raising Cane’s: 4.7 percent
- Zaxby’s: 3.5 percent
- Popeyes: 2.8 percent
- Chick-fil-A: 2.5 percent
- El Pollo Loco: 1.8 percent
- KFC: 1 percent
That’s a pretty promising figure for Church’s when you consider recent movement. Earlier in July, the brand said its same-store sales rose 4.2 percent, with recent transaction growth commensurate, during the first half of its Smokehouse Chicken launch. The chain’s customer counts have been positive year-to-date, which sparked green comp weeks in 14 of the last 17 headed into summer.
As evaluated by Ace Metrix, Church’s new advertising campaign was No. 1 among fried chicken brands year-to-date when compared against other brands’ commercials airing during the same period. The “Bringin’ That Down Home Flavor” TV campaign aired across the country and was part of a new, fully integrated traditional and digital media approach to re-introduce the perennial brand to consumers.
It appears to have legs.
The TV ads featuring the Bourbon Black Pepper Smokehouse Chicken indexed at Ace Scores of 661, well above the category norm of 583. Critical component scores for the TV spot outperformed the quick-serve and chicken category averages in Attention, Likeability, and Desire to Purchase. In response, Church’s said, franchisees are experiencing record sales and traffic growth, even more notable in markets that typically haven’t received media coverage historically.
One example is multi-unit franchisee Noor Samji out of Phoenix. He doesn’t typically invest in media during this time period, he said, since sales dip in their hottest month. “We are now experiencing double digit growth, and wouldn’t have known that to be possible during summer if we hadn’t changed our media strategy to drive awareness across all of our markets,” Samji said in a statement.
Market Force’s data also showed that chicken category customers are fairly likely to consider going to another brand, but are not firmly set on the destination. There is plenty of room for cross fertilization of traffic in this segment.
Alternative options
- Go to a different restaurant brand: 38 percent
- Going to this restaurant brand was my only consideration: 29 percent
- Stay at home/work/school and prepare my own meal: 28 percent
- Pack my own meal to go: 12 percent
- Skip the meal: 12 percent
- Go to a grocery store and purchase ready-to-eat items: 11 percent
- Go to a convenience store and purchase ready-to-eat-items: 4 percent
How does the chicken category do with families?
It’s not as robust as some. Only 17 percent of respondents said they had children under the age of 18 with them while dining.
But the segment did well in some respects.
- Availability of high chairs, booster seats, or other necessary items: 79 percent
- Friendliness of staff in accommodating children’s needs: 75 percent
- Menu options for children: 63 percent
- Activities provided (colors, activity sheet, etc): 61 percent
Where is there room for improvement?
The biggest issue for the study’s chicken chains came in regards to wait times, quality, and order accuracy. The wait time number is worth circling. Study after study convenience keeps landing with force among consumers, even in a segment you’d expect to thrive there.
What type of problem did you experience?
- Inaccurate order: 35 percent
- Long wait time: 33 percent
- Quality of food or beverage was poor: 31 percent
- Staff attitude or behavior issue: 22 percent
- Temperature of food or beverage not as expected: 15 percent
- Taste of food or beverage not as expected 14 percent
- Menu item not available: 12 percent
- Portion not as expected: 11 percent
- Difficulty placing order: 11 percent
- Had to ask for the status of the order or an item: 10 percent
- Restaurant crowded or busy: 8 percent
- Seats/tables in poor condition: 6 percent
- Drink station in poor condition: 6 percent
- Wrong amount charged on bill: 6 percent
- Restroom in poor condition or not available: 5 percent
- Condiment station in poor condition: 5 percent
- App or website difficult: 3 percent
Not surprisingly, Chick-fil-A had the lowest problem experience, with only 3 percent of customers saying they had an issue. Sixty-five percent said it was resolved to satisfaction. Those are pretty stellar figures. Zaxby’s ranked the best at taking care of problems with a 67 percent score.
- Raising Cane’s: 63 percent
- El Pollo Loco: 60 percent
- KFC: 43 percent
- Popeyes: 36 percent
- Church’s: 23 percent
Where is the greatest opportunity to differentiate? Market Force believes it’s in healthy food options.
To the question, please rate your satisfaction during your most recent experience dining at a chicken restaurant, here were the results:
- Friendliness of staff: 63 percent
- Overall cleanliness: 63 percent
- Food quality: 63 percent
- Curb appeal: 59 percent
- Atmosphere: 57 percent
- Speed of service: 57 percent
- Value received for money spent: 48 percent
- Availability of healthy food options: 38 percent
It becomes pretty clear where the whitespace lies.
Another standout result came in loyalty incentive awareness. Does this chicken chain offer a loyalty program for frequent guests? Is there an opportunity then to engage that infrequent user?
- Yes: 30 percent
- I don’t know: 53 percent
- No: 17 percent
By brand to the response yes:
- El Pollo Loco: 61 percent
- Chick-fil-A: 54 percent
- Raising Cane’s: 37 percent
- Church’s: 10 percent
- Zaxby’s: 10 percent
- Popeyes: 4 percent
- KFC: 2 percent
As many chains are realizing, awareness remains the biggest hurdle to digital initiatives and one-to-one marketing. But that’s changing fast.
The other categories
Burgers
In-N-Out took the lead position for the third consecutive year with a 73 percent score. Five Guys was second, followed by Culver’s. Some of the bigger brands ranked near the bottom.

In-N-Out finished No. 1 in value, staff friendliness, cleanliness, and curb appeal. Five Guys, however, unseated the cult-favorite chain this year for atmosphere, food quality, and service speed. Smashburger also earned top marks for healthy options.

Sandwiches
Jersey Mike’s leapt from No. 3 to take the sandwich crown, besting Firehouse, Wawa, and Jimmy John’s. Wawa won the category last year.

The sandwich sector was pretty spread out. Panera reigned over two attributes—healthy options and atmosphere—but scored below competitors on value for money spent. Jersey Mike’s thrived on food quality and staff friendliness. Jimmy John’s, Firehouse, and Wawa ranked highest for service speed, cleanliness, and value, respectively.

Mexican
Chipotle captured the top spot for the third straight year, edging Moe’s and El Pollo Loco.

Chipotle and Moe’s battled it out across the categories. Chipotle took food, while Moe’s won on service. Del Taco topped value—a category Chipotle lagged surprisingly.

Pizza
Rapidly growing Blaze nabbed the No. 1 distinction among pizza chains, followed by Papa Murphy’s and Marco’s Pizza.

Blaze and Papa Murphy’s led in every customer experience category except staff friendliness, which went to Marco’s. Papa Murphy’s scored high on food quality and value. Blaze ruled in atmosphere, curb appeal, and healthy options. Marco’s shined throughout, landing in the top three in every area except value.

Coffee and bakery
Krispy Kreme was the clear customer favorite at 64 percent. Panera (60 percent) and Starbucks (55 percent) followed.

Krispy Kreme came in at No. 1 in half of the eight measures, including food quality, value, cleanliness, and service speed. Panera beat out Starbucks for staff friendliness and was also lauded for its health options, atmosphere, and curb appeal. Starbucks was in the top three for every category except value, where it ranked last with nearly 20 percentage points less than Krispy Kreme. That’s not exactly stunning. Starbucks’ ticket has always been a reflection of its experience and its base, which expects the higher prices.

Frozen dessert and smoothie
Culver’s won this segment, with Cold Stone, Baskin-Robbins, and Dairy Queen trailing.

The brand did so through its customer experience. Of the eight categories, Culver’s sat atop six, including staff friendliness, cleanliness, atmosphere, service speed, curb appeal and value. Old Stone reported the best food quality.