Room to grow?
There is evidence today’s restaurant industry is oversaturated, which could be leading to some of its guest traffic woes (down 3.9 percent in August). Per The NPD Group, last year’s growth was the slowest rate in the past eight years. The data firm counted 660,755 total U.S. restaurants in spring 2018. That was down a percentage point from the prior year.
Looking at just fast casual, the sector boomed visits 8 percent in 2014 and 2015, but growth fell to 3 percent in the year ending December 2018, according to NPD data.
Arguably the leading detractor is the simple reality there are too many restaurants. In the past decade, the number of units leapt close to 16 percent, according to the Bureau of Labor Statistics. And based on figures cited by the The New York Times, restaurants are also now growing at twice the rate of the population. To a large extent, investors drove the expansion. Since the early 2000s, banks, private-equity firms, and other financial-backed powers have poured billions into the food industry. Why? Restaurants have proven more tangible than dot-com start-ups in the last decade. It’s why so many public restaurant companies have been taken private lately. And the acceleration of M&A activity in the sector doesn’t show any signs of slowing.
But we could be starting down a different kind of path moving forward. One not all that different than the split oversaturation forced retail to take during the recession. The idea that the industry won’t vanish by any means, but the cream will rise to the crop. You’re seeing it already with a bifurcated market—some restaurants focusing on speed and accessibility and others zeroing on dine-in experience. The end of the all-things-to-all-people era as we know it, which was so prevalent for restaurants, especially casual-dining brands, just a few years ago.
Read more about the possible upcoming course correction here.
All of that said, limited service remains an enormous sector. Thirty-two of the brands on this year’s QSR 50 had 1,000 or more domestic restaurants.
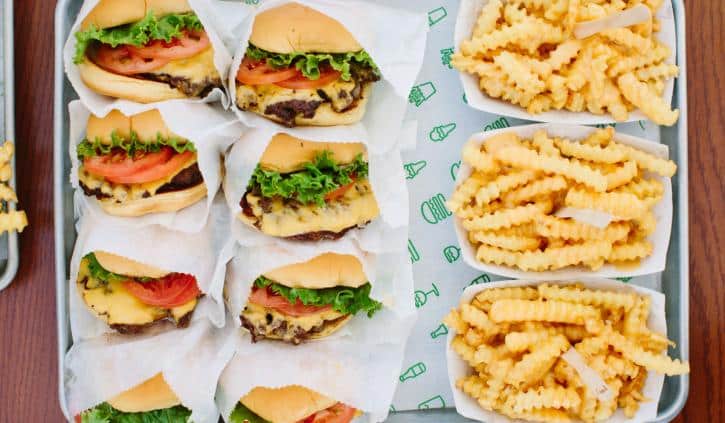
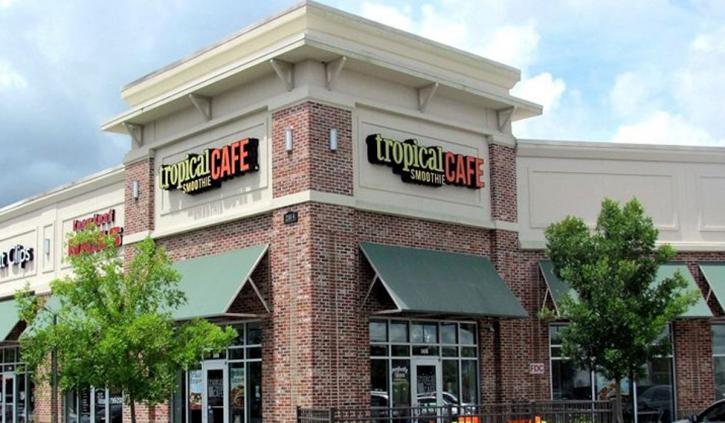
With the top 50 sorted out, which chains are knocking at the door? Here’s a look at 15 brands just outside this year’s rankings. Some are fast approaching the cut, while others are retracting a bit. But there are concepts among the group, like Shake Shack, Tropical Smoothie Café, Smoothie King, and MOD Pizza, to name a few, picking up pace. Tropical Smoothie, in one example, said it plans to hit $1 billion in sales and more than 1,500 locations by 2023.
So, while the restaurant industry might be a crowded place, there is plenty of room to grow for those chains that know their customer and have defined their brand distinctiveness.
Note: Figures are domestic year-end 2018. Brands ranked by total systemwide sales.
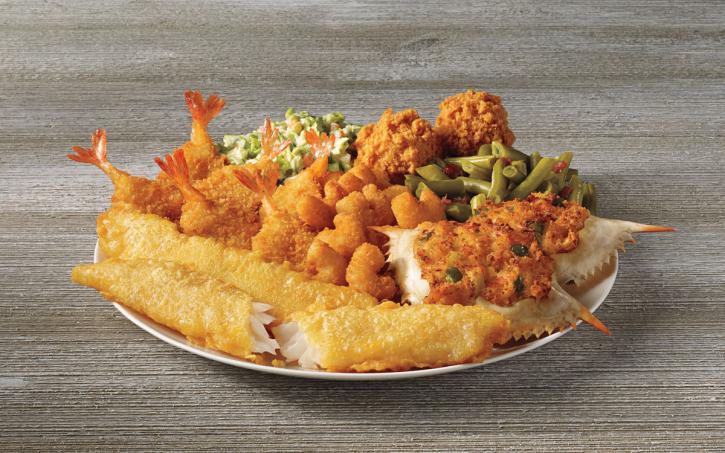
1. Captain D’s
U.S. systemwide sales (millions): $545.34
Average sales per unit (thousands): $1,048.76
Unit count: 536
Franchised stores: 245
Company stores: 291
Total change in units from 2017: 5
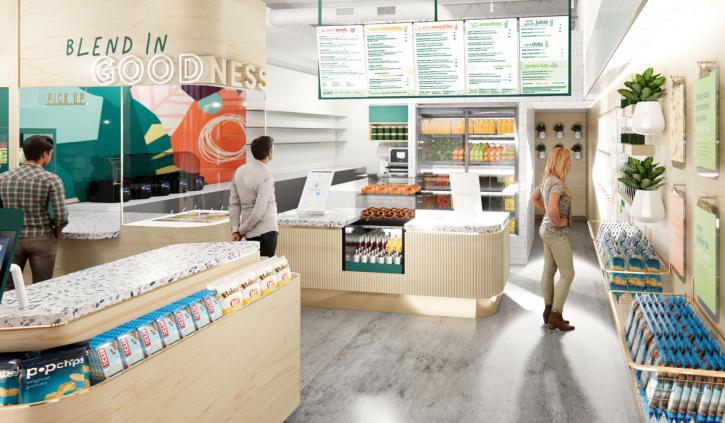
2. Jamba
U.S. systemwide sales (millions): $510.61
Average sales per unit (thousands): $660.39
Unit count: 840
Franchised stores: 729
Company stores: 52
Total change in units from 2017: 38
Jamba drops the juice from its name.
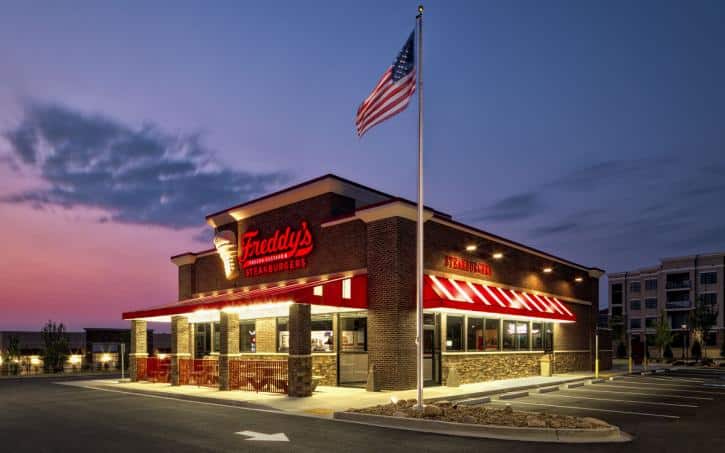
3. Freddy’s
U.S. systemwide sales (millions): $474.70
Average sales per unit (thousands): $1,447.00
Unit count: 328
Franchised stores: 303
Company stores: 25
Total change in units from 2017: 47
Podcast: Creating the Freddy’s way.
4. Tropical Smoothie Cafe
U.S. systemwide sales (millions): $472.63
Average sales per unit (thousands): $730.35
Unit count: 719
Franchised stores: 718
Company stores: 1
Total change in units from 2017: 91
Podcast: Tropical Smoothie’s new CEO Charles Watson shares big plans.
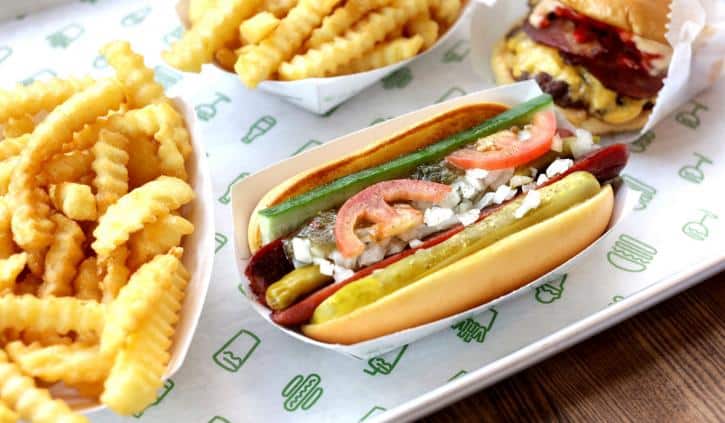
5. Shake Shack
U.S. systemwide sales (millions): $460.00
Average sales per unit (thousands): $3,407.00
Unit count: 136
Franchised stores: 12
Company stores: 124
Total change in units from 2017: 36
Inside Shake Shack’s bold retention strategy.
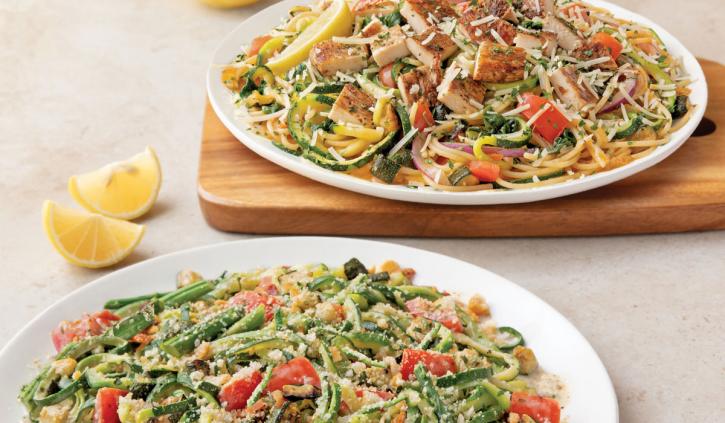
6. Noodles World Kitchen
U.S. systemwide sales (millions): $457.80
Average sales per unit (thousands): $1,130.26
Unit count: 459
Franchised stores: 65
Company stores: 394
Total change in units from 2017: 19
Noodles puts its people first in comeback plan.
7. Potbelly
U.S. systemwide sales (millions): $450.00
Average sales per unit (thousands): $957.00
Unit count: 478
Franchised stores: 41
Company stores: 437
Total change in units from 2017: 2
Turnaround-driven Potbelly turns to franchising.
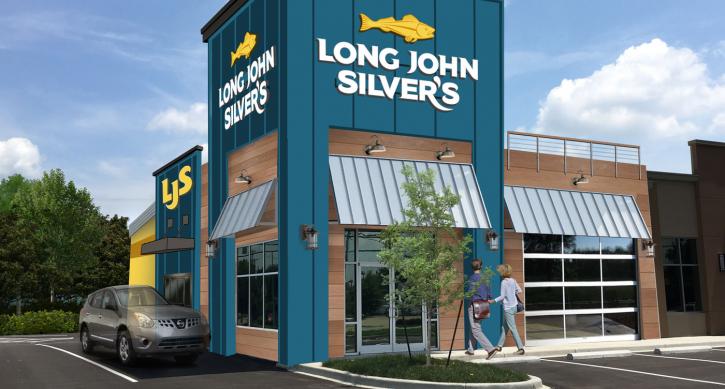
8. Long John Silver’s
U.S. systemwide sales (millions): $440.00
Average sales per unit (thousands): $607.00
Unit count: 832
Franchised stores: 178
Company stores: 654
Total change in units from 2017: –58
Long John Silver’s switches up marketing strategy.
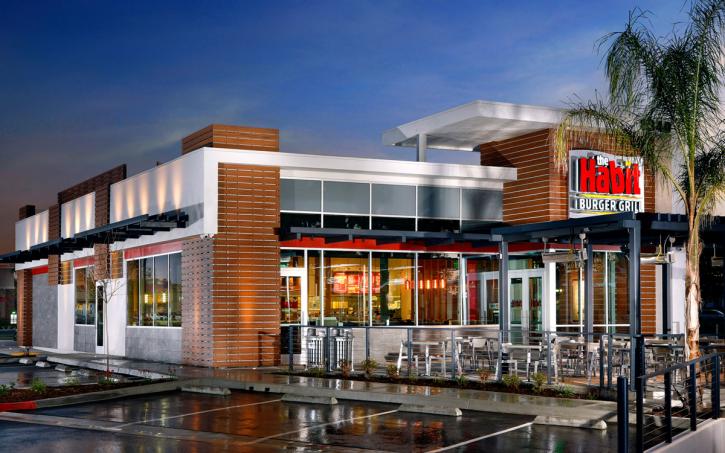
9. Habit Burger
U.S. systemwide sales (millions): $435.00
Average sales per unit (thousands): $1,740.00
Unit count: 243
Franchised stores: 20
Company stores: 223
Total change in units from 2017: 37
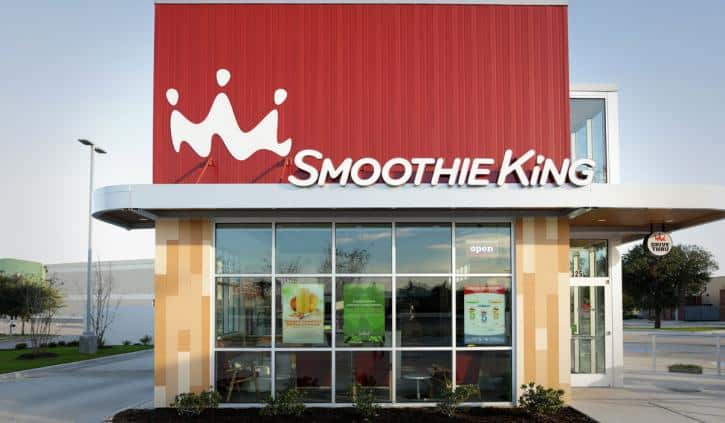
10. Smoothie King
U.S. systemwide sales (millions): $420.00
Average sales per unit (thousands): $498.00
Unit count: 901
Franchised stores: 872
Company stores: 29
Total change in units from 2017: 86
Smoothie King promotes new president.
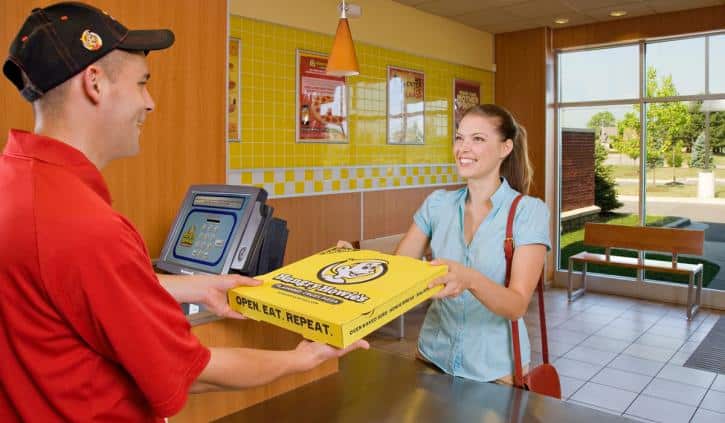
11. Hungry Howie’s
U.S. systemwide sales (millions): $410.93
Average sales per unit (thousands): $720.27
Unit count: 551
Franchised stores: 519
Company stores: 32
Total change in units from 2017: –3
A look at the tech-forward evolution of Hungry Howie’s.
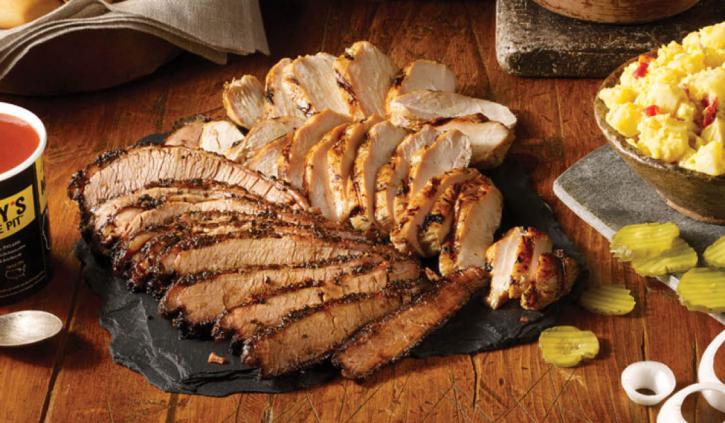
12. Dickey’s
U.S. systemwide sales (millions): $400.00
Average sales per unit (thousands): $762.00
Unit count: 526
Franchised stores: 521
Company stores: 5
Total change in units from 2017: –41
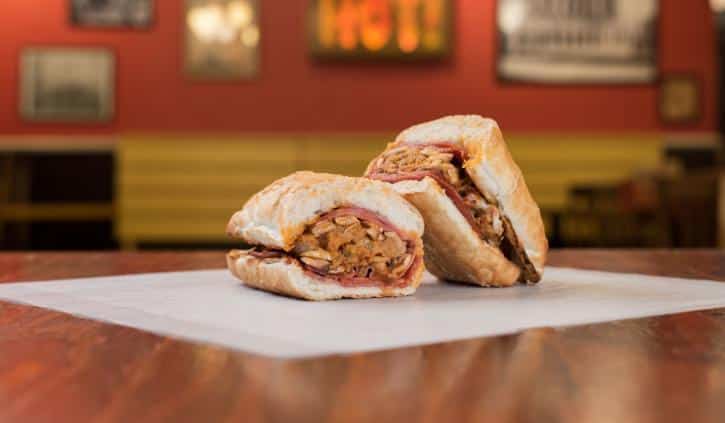
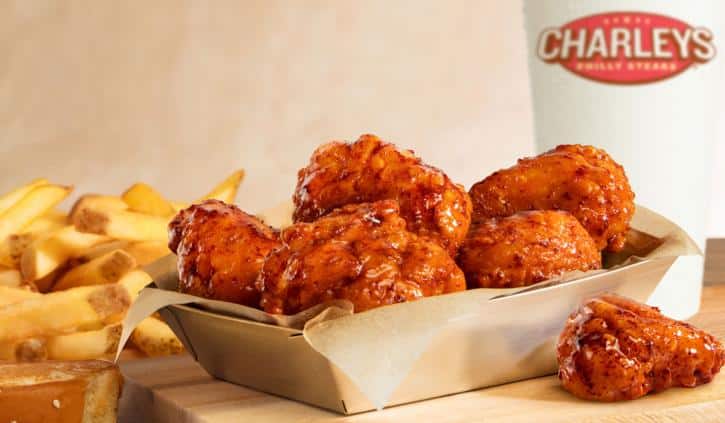
13. Charleys Philly Steaks
U.S. systemwide sales (millions): $400.00
Average sales per unit (thousands): $755.00
Unit count: 528
Franchised stores: 471
Company stores: 57
Total change in units from 2017: 18
Charleys hopes 600 units is one milestone of many.
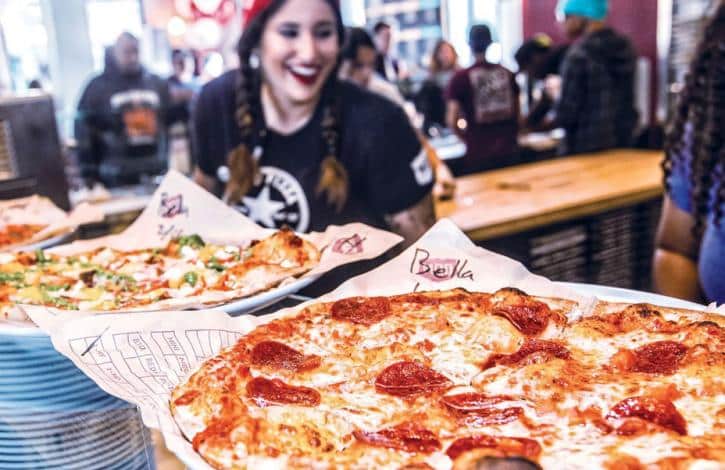
14. MOD Pizza
U.S. systemwide sales (millions): $400.00
Average sales per unit (thousands): $988.00
Unit count: 395
Franchised stores: 93
Company stores: 302
Total change in units from 2017: 98
Podcast: How MOD became the people place for pizza.
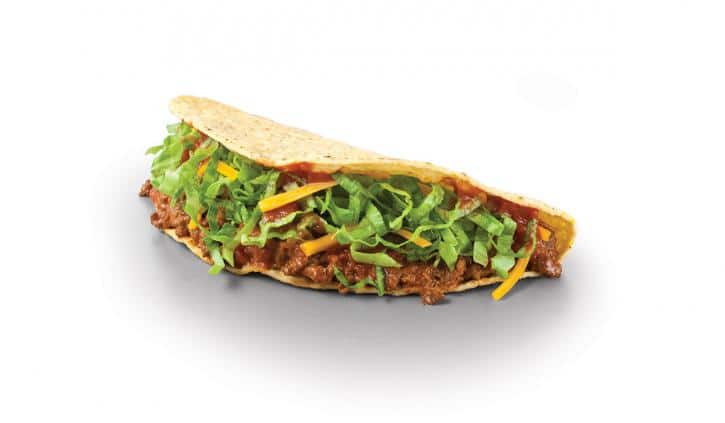
15. Taco Johns
U.S. systemwide sales (millions): $385.00
Average sales per unit (thousands): $987.00
Unit count: 392
Franchised stores: 381
Company stores: 11
Total change in units from 2017: 0