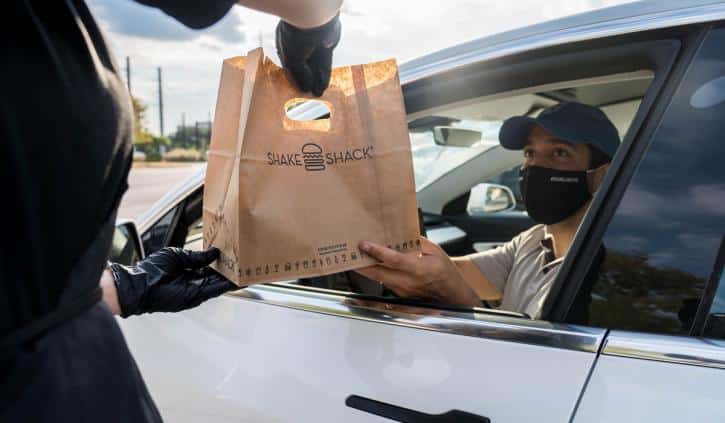
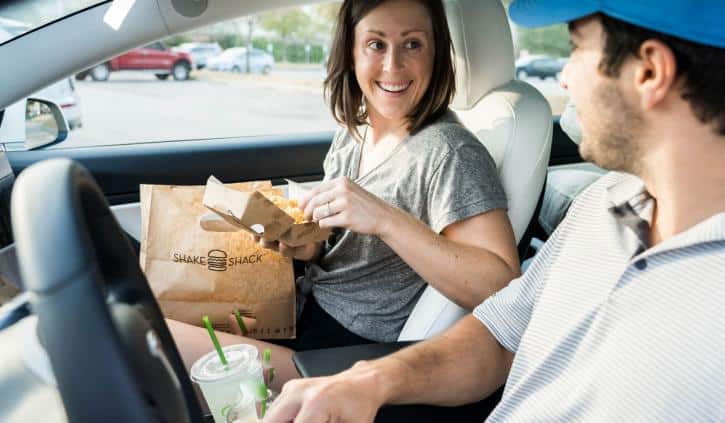
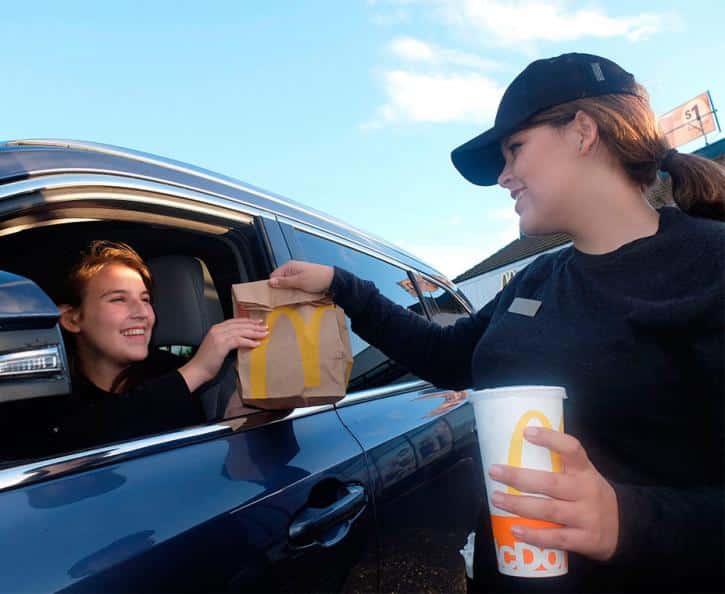
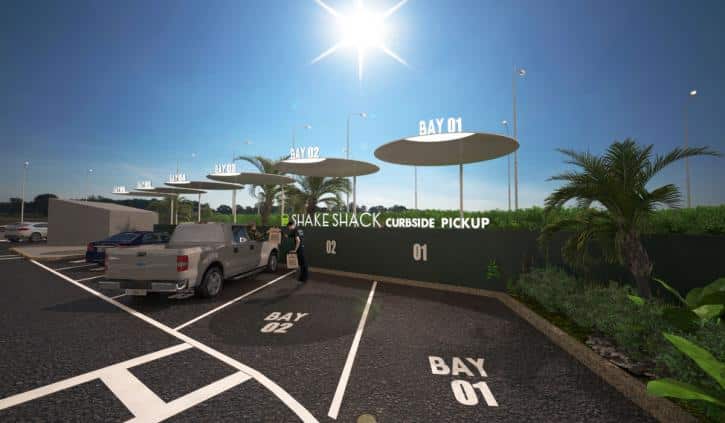
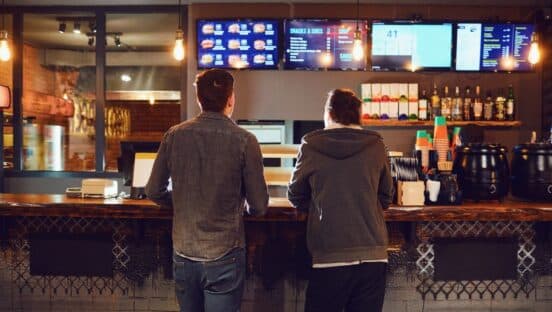
The pandemic has expedited technological innovations for the restaurant industry, including in the drive thru. Tools that once seemed like future fantasies—like mobile ordering and AI—are suddenly becoming commonplace.

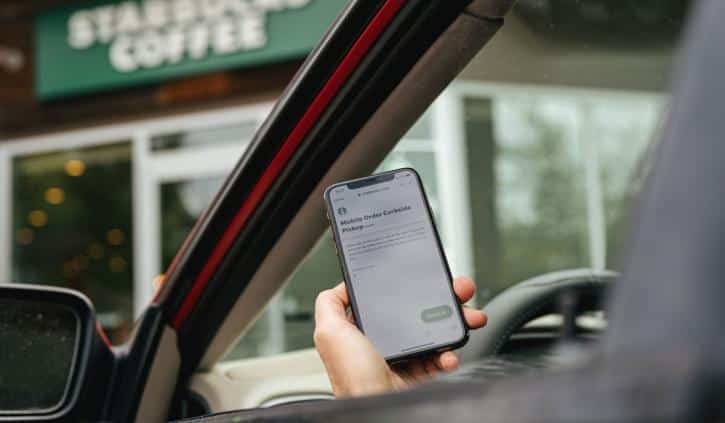
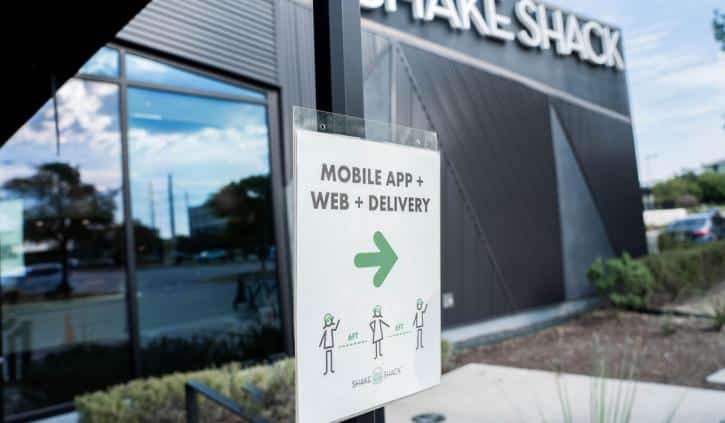
Mobile ordering, in particular, has completely changed the relationship between the customer and the restaurant brand, especially during the pandemic. But not everybody is whole-heartedly embracing mobile solutions for off-premises dining.

WEBINAR: Learn how to elevate the drive-thru experience for guests and employees alike

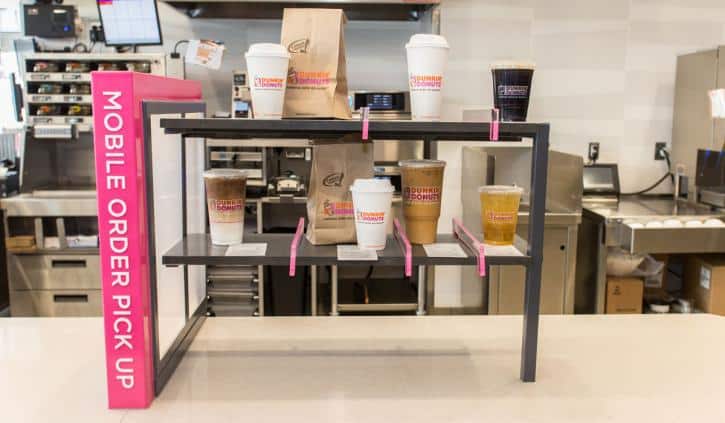
Which ordering models will take on added frequency? Which are considered most accurate?

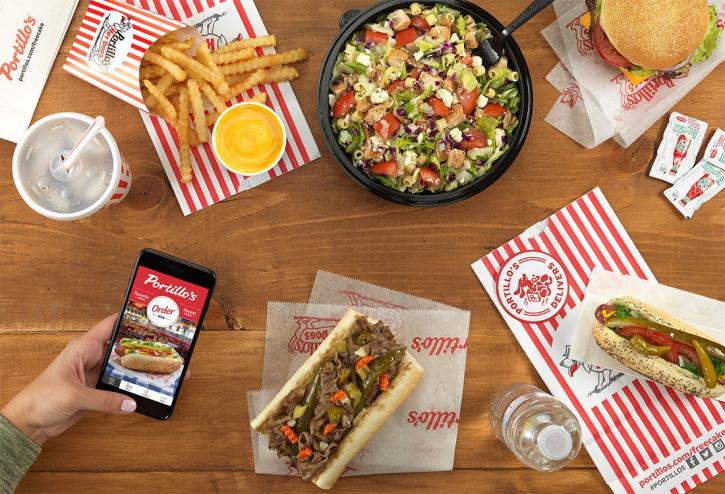
Here’s what consumers think about these opportunities in general, and how much they anticipate using mobile ordering solutions to fulfill their quick-service purchases, from QSR’s® 2020 Drive-Thru Study.

CHECK OUT LAST YEAR’S QSR® DRIVE-THRU STUDY

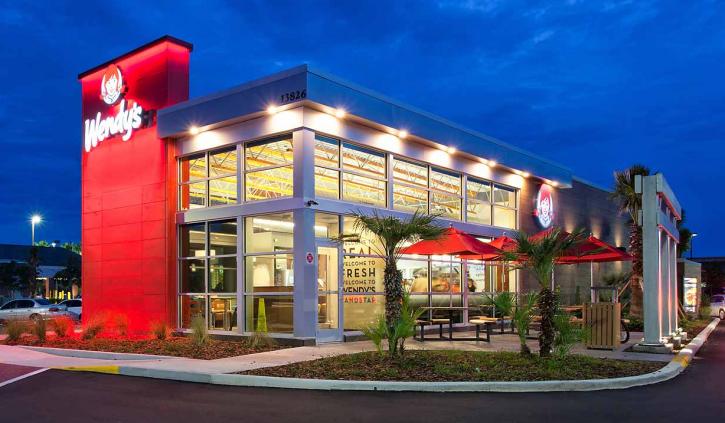
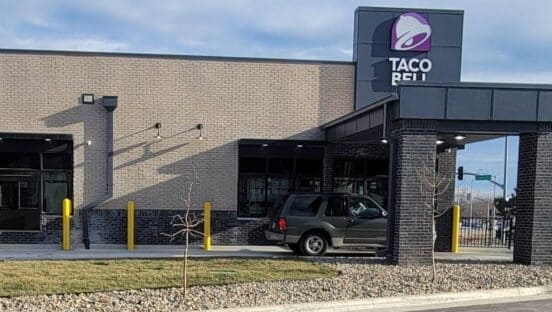
AMERICA PICKS ITS FAVORITE DRIVE-THRU CHAIN

Methodology: The FoodserviceResults team conducted a comprehensive, nationally representative survey of drive-thru consumers in the U.S. using an online survey sample. Participants in the research were screened for frequency of use as well as numerous demographic characteristics in order to ensure that the respondent base was reflective of the U.S. drive-thru market. Leveraging insights from numerous industry experts, the finalized survey was completed among 1,007 drive-thru consumers during fieldwork. To ensure a relevant respondent base was achieved, all participants were screened to include those who had at least one drive-thru occasion in the last 30 days. An extensive cross tabulation of the respondent sample data was conducted in order to identify major trends, demographic/behavioral themes, and other nuances in the data.
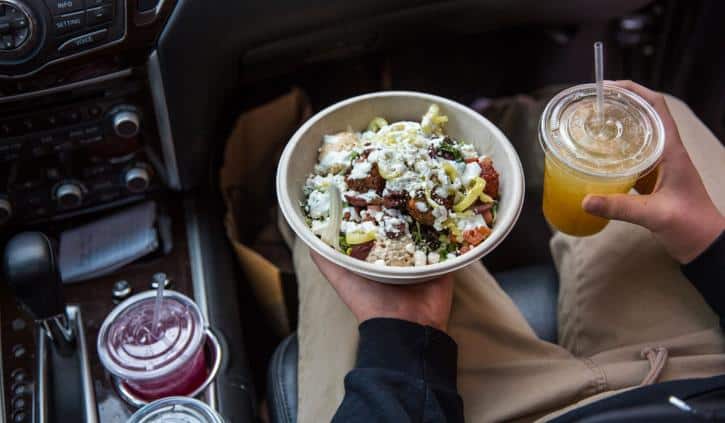
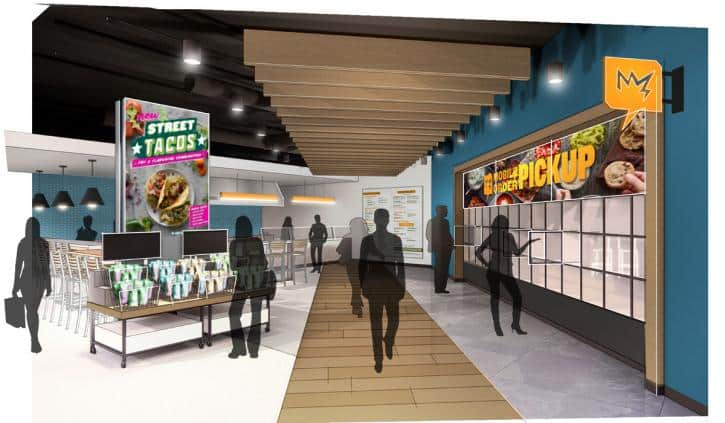
Image credits:Cava

What customers want from drive-thru tech today and into the future

Artificial intelligence helping make decisions when placing order

Overall: 14 percent

Gen Z: 21 percent

Millennials: 23 percent

Gen X: 14 percent

Boomers: 6 percent

See the entire 2020 QSR® Drive-Thru Study here.

Image credits:Chick-fil-A

More extensive digital signage

Overall: 20 percent

Gen Z: 7 percent

Millennials: 16 percent

Gen X: 20 percent

Boomers: 25 percent

See the entire 2020 QSR® Drive-Thru Study here.

Image credits:Zaxby’s

Ordering system that remembers my last order

Overall: 24 percent

Gen Z: 28 percent

Millennials: 26 percent

Gen X: 25 percent

Boomers: 21 percent

See the entire 2020 QSR® Drive-Thru Study here.

Image credits:McDonald’s

Ordering system that remembers me and my preferences

Overall: 30 percent

Gen Z: 21 percent

Millennials: 37 percent

Gen X: 32 percent

Boomers: 22 percent

See the entire 2020 QSR® Drive-Thru Study here.

Image credits:Starbucks

Carhops, placing order from car

Overall: 36 percent

Gen Z: 28 percent

Millennials: 39 percent

Gen X: 31 percent

Boomers: 38 percent

See the entire 2020 QSR® Drive-Thru Study here.

Image credits:Chick-fil-A

Automated technology detecting car arrival, pre-order brought to car

Overall: 36 percent

Gen Z: 31 percent

Millennials: 43 percent

Gen X: 35 percent

Boomers: 31 percent

See the entire 2020 QSR® Drive-Thru Study here.

Image credits:Sonic Drive-In

Mobile ordering options

Overall: 38 percent

Gen Z: 34 percent

Millennials: 42 percent

Gen X: 41 percent

Boomers: 32 percent

See the entire 2020 QSR® Drive-Thru Study here.

Image credits:Qdoba

Contactless payment options

Overall: 42 percent

Gen Z: 48 percent

Millennials: 43 percent

Gen X: 41 percent

Boomers: 41 percent

See the entire 2020 QSR® Drive-Thru Study here.

Image credits:Starbucks

Mobile ordering preferences (how much guests expect to use the following via mobile)

Third-party delivery

Very likely: 32 percent

Not sure: 26 percent

Not likely: 42 percent

See the entire 2020 QSR® Drive-Thru Study here.

Image credits:Dunkin’

Direct delivery

Very likely: 41 percent

Not sure: 28 percent

Not likely: 32 percent

See the entire 2020 QSR® Drive-Thru Study here.

Image credits:Portillo’s

Curbside pickup

Very likely: 45 percent

Not sure: 28 percent

Not likely: 27 percent

See the entire 2020 QSR® Drive-Thru Study here.

Image credits:Shake Shack

Fast-casual drive-thru

Very likely: 45 percent

Not sure: 29 percent

Not likely: 26 percent

See the entire 2020 QSR® Drive-Thru Study here.

Image credits:Shake Shack

Quick-serve drive thru

Very likely: 50 percent

Not sure: 24 percent

Not likely: 26 percent

See the entire 2020 QSR® Drive-Thru Study here.

Image credits:Wendy’s

Future ordering frequency (how guests anticipate their visit frequency in drive thru, curbside pickup, and delivery to change in the next 12 months)

Third-party delivery

More frequently: 13 percent

Same: 34 percent

Less frequently: 17 percent

Not applicable: 36 percent

See the entire 2020 QSR® Drive-Thru Study here.

Image credits:Chipotle

Direct delivery

More frequently: 16 percent

Same: 49 percent

Less frequently: 13 percent

Not applicable: 21 percent

See the entire 2020 QSR® Drive-Thru Study here.

Image credits:Chipotle Mexican Grill

Fast-casual drive thru

More frequently: 18 percent

Same: 63 percent

Less frequently: 12 percent

Not applicable: 7 percent

See the entire 2020 QSR® Drive-Thru Study here.

Image credits:Shake Shack

Quick-serve drive thru

More frequently: 21 percent

Same: 69 percent

Less frequently: 10 percent

Not applicable: 0 percent

See the entire 2020 QSR® Drive-Thru Study here.

Image credits:Arby’s

Curbside pickup

More frequently: 22 percent

Same: 45 percent

Less frequently: 15 percent

Not applicable: 17 percent

See the entire 2020 QSR® Drive-Thru Study here.

Image credits:CURBSIDE INC.

How accurate are these staples and newcomers?

Third-party delivery

Almost always accurate: 29 percent

Occasional mistakes: 25 percent

Frequently inaccurate: 6 percent

Not applicable: 41 percent

See the entire 2020 QSR® Drive-Thru Study here.

Image credits:istock

Curbside pickup

Almost always accurate: 46 percent

Occasional mistakes: 26 percent

Frequently inaccurate: 5 percent

Not applicable: 23 percent

See the entire 2020 QSR® Drive-Thru Study here.

Image credits:Zebra Projects LTD

Direct delivery

Almost always accurate: 47 percent

Occasional mistakes: 24 percent

Frequently inaccurate: 4 percent

Not applicable: 25 percent

See the entire 2020 QSR® Drive-Thru Study here.

Image credits:Jimmy John’s

Quick-service drive thru

Almost always accurate: 49 percent

Occasional mistakes: 42 percent

Frequently inaccurate: 9 percent

Not applicable: 1 percent

See the entire 2020 QSR® Drive-Thru Study here.

Image credits:Taco John’s

Fast-casual drive thru

Almost always accurate: 50 percent

Occasional mistakes: 31 percent

Frequently inaccurate: 5 percent

Not applicable: 14 percent

See the entire 2020 QSR® Drive-Thru Study here.

Image credits:The Howard Company
Drive Thru, QSR Slideshow