When e-commerce blanketed retail, it reshaped a physical world that, from 1970–2015, saw malls grow at twice the rate of the population. Mom-and-pops and big-box companies alike grappled with the “Amazon effect” as couch-shopping threatened in-store traffic. But it wasn’t an unexpected apocalypse as much as a course correction, Partners + Napier said at the time. Or as Warby Parker president Neil Blumenthal once noted, “It’s not the end of retail; it’s the end of bad retail.”
In a lot of ways, this took on life for restaurants pre-pandemic as well. The industry, too, per The Wall Street Journal, was ballooning at twice the rate of the population—a reflection of an investor-fueled boom that began in the early 2000s, when banks, firms, and other financial-backed powers started to pour billions into the industry as an alternative to dot-com startups.
Restaurants, in turn, approached a “zero-sum” point where bankruptcies were as common as growth stories. And along the way, a similar distinction formed: Restaurants that adapted to evolving demands found avenues to profit. The margin of error for “bad restaurants” thinned. That was evident in declining guest counts throughout, but a divergent impact that favored some over others.
Coming into COVID, off-premises sales increased nearly four times faster than dine-in business, accounting for about 80 percent of restaurants’ U.S. dollar sales growth over the last three years, according to financial services company Rabobank.
Dave Bennett, CEO of Mirus Restaurant Solutions, predicted in 2019 the industry was headed for a split of sorts. One side retail focused and the other convenience centric.
So did the pandemic bring his hypothesis into focus?
One thing that’s clear is restaurants today face another fate retail understands rather well—the sudden table-stakes of “intuitive experiences.” Digital features, such as QR codes and mobile payment, have given consumers the ability to tailor their dining experience to their needs.
A recent report from PYMNTS and Paytronix, based on census-balanced surveys of 2,545 U.S. consumers, explains it as, “Americans desire for seamless, customizable restaurant experiences,” and something only made more apparent during COVID due to how the pandemic disorganized dayparts. Put another way, where guests expect convenience, or frictionless ordering, is no longer restrained to a specific time or day or channel. Consumers prefer to engage in buying experiences that match their “in-the-moment” needs.
And like retail adjustments of the early 2000s, this is one trend that doesn’t appear to be subsiding.
Yet a divide exists, too, going back to Bennett’s crystal ball. Many independent restaurants see the rise in popularity of delivery service aggregators as a threat to their share because local patrons have easier access to competitors, as well as large chain restaurants, the report noted. But this fact (delivery’s category share of foodservice sales doubled to more than 15 percent during the pandemic, according to Rabobank), could also be viewed as an opportunity to reach new audiences.
While a chain example (and maybe that’s part of the challenge ahead), The Cheesecake Factory said in November its “frequent cohort,” or core guests, bumped usage to 20 trips a year from 14 pre-COVID. Notably, a third of the chain’s “frequents” were new to the brand. And Cheesecake Factory adjusted marketing and communication to keep those guests coming back, whether for in-store visits, via white-label options, or through more delivery and introductory offers. People picked Cheesecake Factory based on what their occasion was, the brand said. This is a lesson that can be mirrored.
“Independent restaurants and foodservice brands that wish to engage customers and retain their loyalty would be wise to adopt digital features that improve purchasing convenience and efficiency,” the report said.
Mobile data and analytics provider App Annie’s 2022 State of Mobile Report highlighted a parallel shift that speaks to why it’s an arena worth diving into. Users spent 49 percent more sessions, year-over-year in food and drink apps last year, reaching 62 billion sessions.
Why are consumers turning to aggregators to improve their experiences? How can restaurants leverage digital tools to compete? It begins with a straightforward point: the consumer of the future has become the modern one, well before we expected to meet them. Or, as PYMNTS and Paytronix labels this new, critical diner—the “multiplatform user.”
Experiences guest rely on
Since COVID’s onset, according to PYMNTS and Paytronix data, 42 percent of consumers have used at least one aggregator and 15 percent have used three or more (the multiplatform user). To App Annie’s figures, diners flocked to apps and other mobile ordering options when they had little choice. And that’s held thanks to a desire for simplicity and convenience that’s stuck around.
“Even as consumers have regained access to their favorite restaurants, multiplatform aggregators still provide the kind of time-saving conveniences many consumers, especially affluent younger adults, have come to rely on,” the report said.
Consumers’ ongoing embrace of multiplatform aggregators stems from a desire for simplicity and convenience, it added.
Consumer aggregator use
Share of respondents who used select numbers of food aggregators over the past 18 months, by annual income:
Multiplatform (three or more)
- More than $100K annual income: 22.5 percent
- $50–$100K: 14.4 percent
- Less than $50K: 6.7 percent
One or two platforms
- More than $100K annual income: 27.1 percent
- $50–$100K: 27.9 percent
- Less than $50K: 22.7 percent
No aggregator
- More than $100K annual income: 50.4 percent
- $50–$100K: 57.7 percent
- Less than $50K: 70.5 percent
Multiplatform users are also more likely to be millennials (34 percent) and possess a college education (20 percent) than the average restaurant consumer. The report found “ease and convenience” were the top reasons guests use both single- and multiple-delivery aggregators, and 56 percent of respondents who use three aggregators or more say they do so to obtain faster delivery, while 47 percent want discounts and offers.
Reasons:
Ease and convenience
- People who use one or two platforms: 64.3 percent
- Multiplatform: 59.9 percent
Only method available
- People who use one or two platforms: 28.4 percent
- Multiplatform: 54.9 percent
Faster delivery
- People who use one or two platforms: 26.1percent
- Multiplatform: 55.6 percent
Discounts and offers
- People who use one or two platforms: 25.3 percent
- Multiplatform: 46.6 percent
Ordering and payment experiences
- People who use one or two platforms: 27.9 percent
- Multiplatform: 38.7percent
Lower prices
- People who use one or two platforms: 15.7 percent
- Multiplatform: 40.1 percent
Naturally, the battle to win this “multiplatform” cohort is fast gaining, especially in quick service. While app real estate remains valuable to consumers, COVID opened the funnel. According to Apptopia VP of Insights Adam Blacker, the top 10 quick-service restaurant apps in the U.S. in December were downloaded 19.6 percent more than those the month prior. With 11.6 million new installs across the grouping, it marked the top month for the ranking since Apptopia started tracking in May of last year. The gains mainly came from Burger King and McDonald’s, which grew month-over-month downloads 162 percent and 16.5 percent, respectively.
In all of 2021, McDonald’s paced the field with 24 million app downloads (U.S.) Starbucks followed at 12 million and Domino’s at 10 million. Through free food promotions and celebrity meal deals (loyalty also launched in July for the first time), McDonald’s app was downloaded 33.3 percent more times in 2021 than 2020.
By mid-December, MyMcDonald’s Rewards surged past 21 million members. In Q3, digital mixed more than 20 percent of sales in the chain’s top six markets, or about $13 billion year-to-date at that point. That included sales through the app, in-store kiosks, and delivery.
The overall point being, guests are simply downloading fast-food apps steadier than they used to. Burger King ran a 48-hour promotion (Whopper for 37 cents in honor of its original price and 64th birthday) on December 4 and, per Apptopia data, saw 209,000 mobile app downloads. That trailed only the famed “Whopper Detour” promotion of 283,000 downloads in 2018.
It’s clear guest experience is becoming more connected.
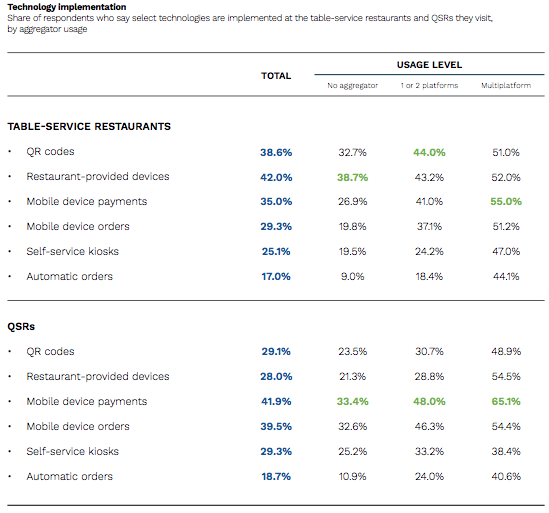
Multiplatform consumers who use delivery aggregators also seek digital-first features at local restaurants, such as mobile devices and QR code menus, the PYMTS and Paytronix report said.
They’re “digital savants,” using available technologies to save time at a rate that is nearly twice that of delivery aggregator non-users. That means consumers often gain time when they use digital-first tools such as mobile payment apps to make purchases, and this boosts customer loyalty (more on this later).
Just 33 percent of guests who do not use aggregators said they had access to mobile payments at the quick-service restaurants they frequent. In contrast, 65 percent who use more than three platforms do. At full-service restaurants, those who avoid aggregators use digital-first technologies 33 percent of the time, while multiplatform do so at a 51 percent clip.
Consumers who do not use aggregators were also likely to be Baby Boomers and seniors (87 percent) and have lower incomes (70 percent earn less than $50,000 per year).
“Digital-first technologies are more than just user-friendly features on a website—they represent a proactive approach to designing user experiences around convenience and efficiency,” the report said.
This is an important concept amid today’s inflationary and labor backdrop, where delivering customer experience has become a challenging aim. In one illustration, the percentage of all hourly employees 18-years-old or younger continues to increase for both limited-service and full-service restaurants, according to Black Box Intelligence. The increase was more than twice as large among limited-service brands. Given the size of these segments, particularly quick service, there are now hundreds of thousands more teenagers employed than in late 2020. And the average tenure for hourly employees in limited-service and full-service brands decreased by a little over two years in the 12 months between October of 2020 and 2021. Plainly, operators are staffing restaurants with more inexperienced employees.
Boosting loyalty through convenience and frictionless ordering, however, is one area to take some pressure off.
Not surprising, multiplatform users in the study sought restaurants with convenience-focused digital tools.
This conversation, though, always comes back to cost. Nearly half of consumers in the study said prices are higher through aggregator platforms than direct at restaurants (44 percent in quick service and 47 percent in full).
Multiplatform users were more concerned with longer wait times than other groups, with 60 percent of patrons at quick-serves and 57 percent full-serves claiming they were concerned about the time they spend having their orders fulfilled.
Convenience or not, 52 percent of respondents credited “avoiding delivery fees” as their top motivating factor for ordering direct. And when they do go straight to the restaurant, they still care about saving time (57 percent), accessing loyalty (56 percent), and gaining access to offers and discounts (55 percent).

And on the direct side:

Pricing is the wild card. Seniors and Baby Boomers (58 percent) are more conscious of the heavy ticket delivery carries. “Bridge millennials” are more focused on saving time (53 percent). But regardless, pricing, including accessing special offers and discounts, pulsed as major concerns among every group surveyed.
The report also asked respondents what factors could prompt them to consider using aggregators in the future.
- Lower delivery and service fees: 30.5 percent
- Faster delivery experience: 19.2 percent
- Faster ordering experience: 15.3 percent
- Preferred payment method is accepted: 14 percent
- Bonus offering on sign-up: 13.8 percent
- Ordering from preferred restaurant: 12.7 percent
- None: 33.5 percent
“Consumers who use aggregators do so for convenience and better user experiences, but cost also is a key element in the decision-making process for those considering becoming aggregator users,” the report said.
A counter, again, has become the surge in loyalty programs. Nearly 50 percent (48) of respondents said they’ve used loyalty programs in at least one type of restaurant during PYMNTS’ and Paytronix’s last three surveys. Data showed loyalty implemented increased 4 percent over a span of three months.
Technologies that impact consumers most
Share of respondents identifying select technologies as most impactful for encouraging purchases at restaurants:
- Order-related abilities: 25 percent
- Pickup-related abilities:17.3 percent
- Payment-related abilities: 16.7 percent
- Loyalty or rewards program: 14.6 percent
- Menu updates: 8.6 percent
- QR code: 5.6 percent
“Convenience has a reputation for impacting consumer choice in restaurant service, but pricing influences all demographics’ decision making,” the report said. “Pricing is not a linear concept for many consumers: surcharges and delivery fees appear to be perceived as friction during an order, but they often are overcome by advantages in convenience and user experience. Generations prioritize costs differently as well. Younger consumers are willing to pay a premium to save time, while seniors and baby boomers tend to sacrifice convenience to avoid delivery fees when choosing how to purchase from restaurants.”