


Consumers make the call
As Papa Johns CEO Rob Lynch said earlier in the year, “the customer has spoken.” It’s perhaps the most agreeable of the COVID-19 fallouts—the idea consumers are now calling the shots. If you chart the industry’s innovation over the past two-plus years, guest-facing shifts have fallen into three main buckets:
The ability, and preference, to order ahead.
Contactless payment.
The tools to do all of those things via mobile.
Of course, there are additional changes afoot, from AI and automation to NFTs, the metaverse, robotics, and the evolution of POS systems from end-points into integrated hubs. But, for the restaurant guest, it’s handheld, convenience-centric updates that have come furthest. And a brand’s ability to strip friction across ordering points is where tech and experience melded—how many clicks it takes to order; whether or not ordering feels as convenient as browsing Amazon.
In a recent survey, location tech company Bluedot asked consumers what they felt was the most improved aspect of the fast-food experience since COVID. Fifty-eight percent picked “mobile app ordering,” followed by curbside pickup (44 percent), web ordering (29 percent), drive-thru (25 percent), and offers (21 percent).
The top three least improved areas: Taste, ideal food temperature, and order accuracy.
It bears asking, at this recovery stage, whether or not fast-food chains can measure guest experience as they once did.
Going back to QSR’s magazine’s Drive-Thru Study in October, 89 percent of respondents said order accuracy was “somewhat” or “most” important to them with their experience. Speed of service was next at 88 percent. Both climbed from 2020 figures of 87 and 84 percent, respectively, which hints higher standards emerged from increased usage (more on this later). But the No. 1 reason for a drive-thru visit was “convenience,” at 75 percent, not speed (45 percent), which surfaces yet another point: Is convenience something we need to examine through multiple filters now thanks to the pandemic? For instance, is getting an order wrong in the drive-thru as inconvenient as being asked to wait longer? Or having a poor experience with disconnected technology? What is the tipping point?
Oracle Food and Beverage’s “Restaurant Trends for 2022” study spotlighted some statistics worth circling as the industry seeks answers in COVID’s wake.
Let’s start with parity. From Starbucks to Sweetgreen to Chipotle, fast casual’s real estate tradition has all but vanished in recent months, as Firehouse Subs CEO Don Fox explains here. A category born from the in-line, leased market in the 1990s into early 2000s—an effort to better ROI versus how large quick-serves historically grew (with traditional, freestanding drive-thrus)—has begun to chase access just as larger category peers have. Brian Cahoe, KFC’s chief development officer, told QSR the industry’s COVID retraction wasn’t necessarily a blanket event like early predictions suggested. Just as off-premises strength helped KFC achieve its first net-new unit positive growth run in 17 years in 2021, and insulate it during the worst of 2020, it was also “a part of the momentum for competitors.” The availability and cost of drive-thru real estate, or pads that can be permitted or zoned for drive-thru, “arguably, has got more competitive since the pandemic started,” he said.
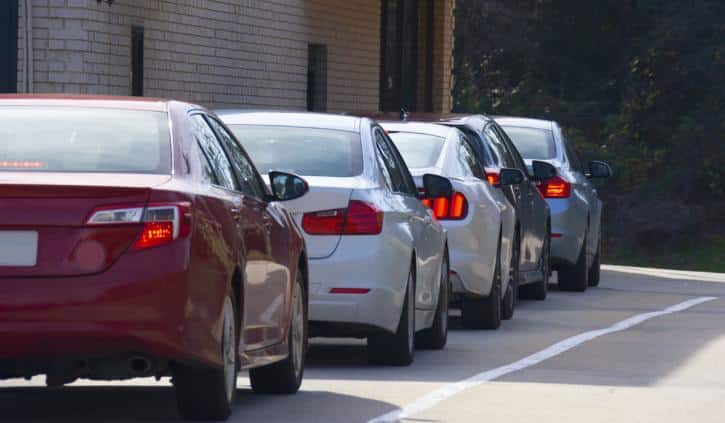
Essentially, drive-thru was a strength and pandemic life raft for restaurant chains like KFC, McDonald’s, Wendy’s, etc., helping many brands generate same-store sales well above 2019 baselines once dine-in returned. But it was also a strength for everybody else.
In February 2022, and September, May, and February of the previous year, per Bluedot, the percentage of consumers who visited a drive-thru in the last month was at, or just under, 90 percent. A month after COVID hit, the figure was 79 percent. So drive-thru visitation has remained consistently 10 points higher than early pandemic days, when people weren’t sure if packaged food was even safe.
Digital access raised the stakes. With dine-in coming back, however, striking an operational balance between traditional and new channels has become a visible debate.
In Oracle’s study, 45 percent of consumers said the wait time feels longer when ordering in-person versus digitally. And 38 percent of guests dining in said they felt deprioritized compared to online orders.
Liz Moskow, food futurist and principal at Bread and Circus, said there’s a danger point here as consumer patterns bounce back. “They’re basically saying we prefer not to interact with you,” she says of a fast casual experience she had recently. “And you’ll get preference if we don’t.”
“What needs to change,” Moskow adds, “and that’s not being addressed, is how do we train our staff that’s digitally native in a way that doesn’t involve them just looking at their phone or a card, because what’s happening is people are going in-store for an in-store experience and they’re not getting eye contact. And they’re not getting the human elements, the touch that they’re looking for. And so, it’s driving it more to digital, even though what the consumer is really craving is that hospitality touch.”
Oracle asked respondents if click-and-collect would influence their decision making. Sixty-three percent said they “love it” and it “positive impacts” where they eat. Forty-four percent added it makes them more loyal.
Globally, the average was 59 percent for guests who’d spend more if the service was available.
Data showed an increasing preference for contactless pay, too, with 40 percent preferring it, and a slow emergence for alternative payments like cryptocurrency (4 percent).
Consumers were highly invested in sustainability practices as well: 93 percent said it was important restaurants make efforts to reduce food waste, and 87 percent felt transparency about sustainable initiatives was important.
Pulling back, the next few months are going to be defined as much by fine-tuning as advancement. Meaning, the industry’s top brands will dig further into what customers gave them credit for during COVID—much of which was already on the table before the crisis, yet sped into action when brands were forced to meet guests where they were.
Here are 25 consumer trend statistics, from Oracle, to keep an eye on.
Note: If viewing on desktop, please click the arrows in the picture above to continue.
Dine-in frequency (next three to six months)
Every day: 10 percent
Once or twice a week: 36 percent
Once or twice a month: 29 percent
Less often: 18 percent
Never: 7 percent
According to a recent Datassential survey, more than two in five people were back to having “no concern” while going out to eat—up 4 percent since February.
Something to monitor: Two-thirds of consumers, per Datassential, who have not returned to an office would prefer to stay working from home at least some of the time. So guest counts at lunch could be challenged.
The No. 1 consideration for choosing a restaurant, even now, was clean and sanitary, at 68 percent, followed by great taste (60 percent); good service (56 percent); value (51 percent); health (44 percent); nearby (41 percent); supporting local restaurants (30 percent); variety (28 percent); locally owned (27 percent); and speed (21 percent).
More on the sanitary point, the “cleanliness theater” many operators adhered to during COVID remains in play, if not as prevalent. For instance, regularly and visibly wiping down tables, kiosks, and other high touch points was a “requirement” for 81 percent of consumers polled by Datassential in January 2021. Come March, it was closer to 70 percent. Higher than pre-COVID, but not as hyper elevated as it was during the plunge.
Preferred way to order, dining-in at a restaurant
In-person interaction: 65 percent (this number was 82 percent for Boomers)
Restaurant mobile app: 10 percent
Third-party mobile app: 8 percent
Self-service kiosk: 8 percent
Google or social: 5 percent
Voice assistant: 4 percent
Preferred way to order, when getting takeout
Restaurant mobile app: 33 percent
In-person interaction: 25 percent
Third-party mobile app: 18 percent
Google or social: 10 percent
Self-service kiosk: 8 percent
Voice assistant: 7 percent
Preferred way to order, at the drive-thru
In-person interaction: 38 percent
Third-party mobile app: 20 percent
Restaurant mobile app: 18 percent
Self-service kiosk: 10 percent
Google or social: 8 percent
Voice assistant: 7 percent
Consumer sentiment on whether in-person orders take significantly longer than order-ahead and drive-thru customers
Agree: 47 percent
Neutral: 28 percent
Disagree: 25 percent
Consumer sentiment on whether online and delivery orders are prioritized over in-person customers
Agree: 34 percent (this jumps to 42 percent for millennials and 40 percent for Gen X)
Neutral: 44 percent
Disagree: 21 percent
Consumer sentiment on the restaurant atmosphere impact of delivery riders and drivers picking up orders
Agree: 29 percent (soars to 46 percent for millennials and 41 percent for people with children)
Neutral: 31 percent
Disagree: 40 percent
Time before consumers are annoyed, waiting to order when seated at a table in a restaurant
1 minute: 2 percent
2 minutes: 9 percent
5 minutes: 33 percent
10 minutes: 27 percent
15 minutes: 14 percent
20 minutes or more: 14 percent
Time before consumers are annoyed, waiting to order when ordering in a drive-thru
1 minute: 8 percent
2 minutes: 22 percent
5 minutes: 35 percent
10 minutes: 20 percent
15 minutes: 9 percent
20 minutes or more: 6 percent
Time before consumers are annoyed, waiting to receive their order when seated at a table in a restaurant
1 minute: 3 percent
2 minutes: 8 percent
5 minutes: 19 percent
10 minutes: 24 percent
15 minutes: 23 percent
20 minutes or more: 24 percent
Time before consumers are annoyed, waiting to receive their order when ordering at a counter
1 minute: 4 percent
2 minutes: 11 percent
5 minutes: 30 percent
10 minutes: 31 percent
15 minutes: 17 percent
20 minutes or more: 8 percent
Time before consumers are annoyed, waiting to receive their order when ordering in a drive-thru
1 minute: 4 percent
2 minutes: 15 percent
5 minutes: 36 percent
10 minutes: 27 percent
15 minutes: 10 percent
20 minutes or more: 7 percent
Diving deeper into personal offers
Consumer sentiment on receiving special offers and promotion notifications based on their current location
Love this: 56 percent
Neutral: 30 percent
Not interested: 14 percent
Consumer sentiment on having the ability to manage dietary preferences and share them with restaurants they visit or order from
Love this: 43 percent
Neutral: 32 percent
Not interested: 25 percent
Consumer sentiment on receiving preference suggestions based on their purchase history
Love this: 37 percent
Neutral: 41 percent
Not interested: 23 percent
Consumer sentiment on understanding and controlling who has access to the data they share with restaurants and delivery companies
Love this: 56 percent
Neutral: 30 percent
Not interested: 13 percent
Consumer sentiment on receiving offers from partner brands of the places they order from (e.g. other restaurant brands or stores)
Love this: 43 percent
Neutral: 38 percent
Not interested: 20 percent
Into spend and loyalty
Consumer sentiment on click and collect service offer
Love it: my preferred way to order: 35 percent
Positively influences where I eat: 24 percent
Useful, but not influential: 24 percent
Not important: 18 percent
Consumer sentiment on click and collect’s impact on their loyalty
Makes me more loyal: 43 percent
Does not influence my loyalty: 34 percent
Irrelevant to me: 22 percent
Consumer sentiment on click and collect’s impact on spending habits
I’d spend a lot more: 30 percent (leaps to 55 percent for millennials; 40 percent for Gen Z; and 48 percent for those with children)
I’d spend a bit more: 24 percent
It would not impact my spending: 46 percent (79 percent for Boomers)
ESG thoughts
Biodegradable or recyclable food packaging influence on consumer buying decisions
Love it: Influenced where I buy from: 37 percent
Nice to have but not influential: 45 percent
Not at all important: 19 percent
Low or zero emission takeout delivery services influence on consumer buying decisions
Love it: Influenced where I buy from: 31 percent
Nice to have but not influential: 45 percent
Not at all important: 24 percent
Efforts to lower food waste influence on consumer buying decisions
Love it: Influenced where I buy from: 47 percent
Nice to have but not influential: 39 percent
Not at all important: 13 percent
Clear labelling of food source and ingredients influence on consumer buying decisions
Love it: Influenced where I buy from: 45 percent
Nice to have but not influential: 39 percent
Not at all important: 16 percent
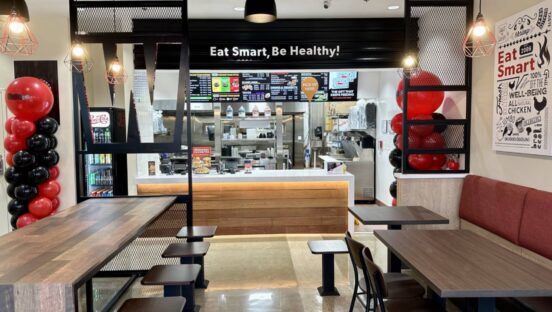
Consumer sentiment on the importance of restaurants always offering a healthy option on their menu
Love it: Influenced where I buy from: 58 percent
Nice to have but not influential: 32 percent
Not at all important: 10 percent