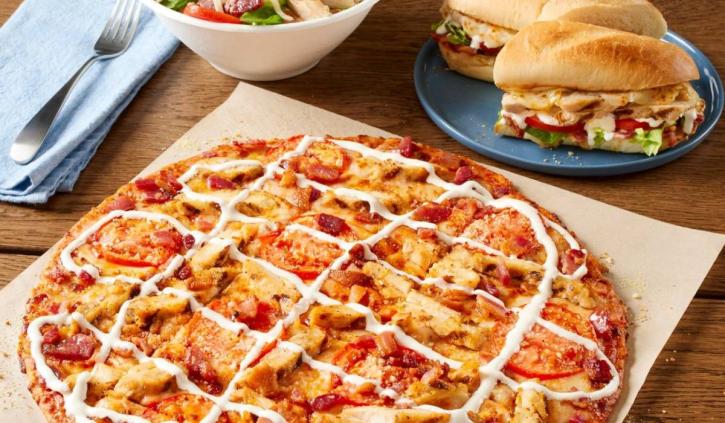

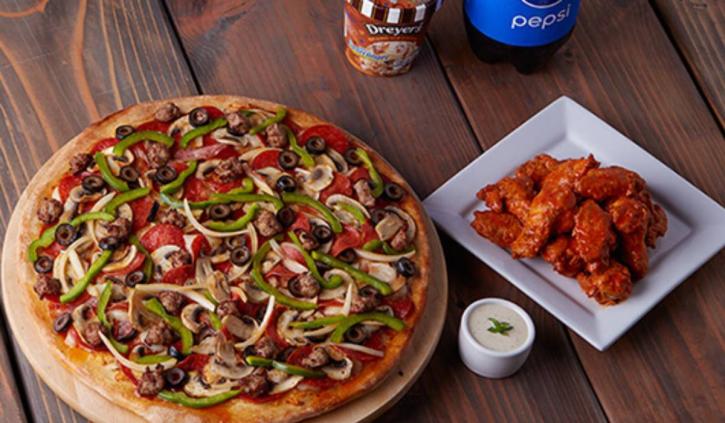
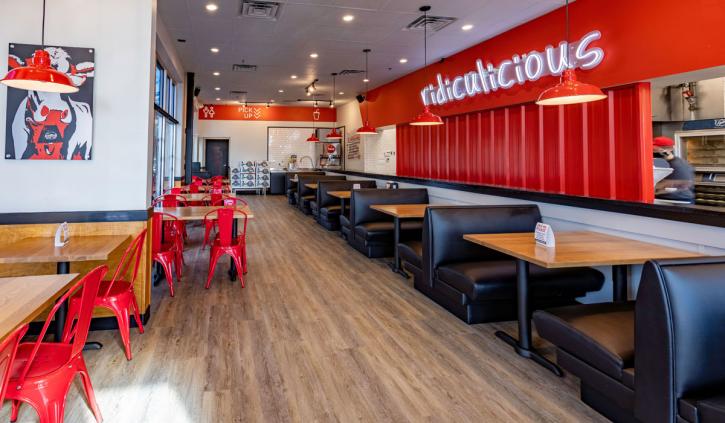
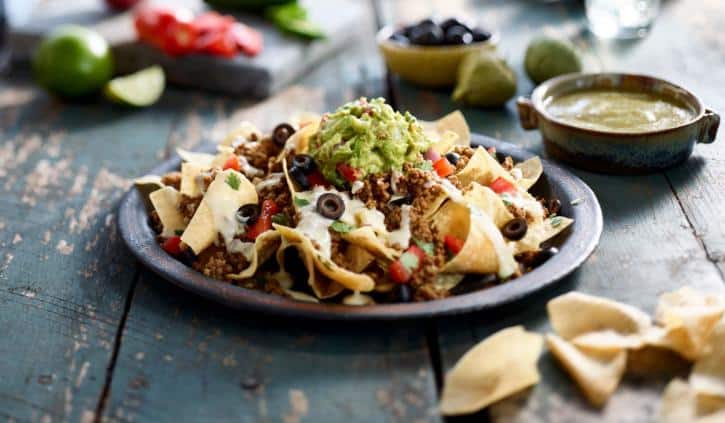
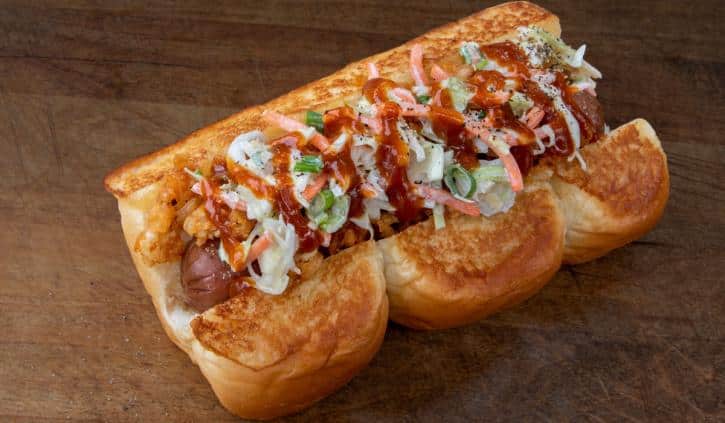




While the quick-service restaurant industry’s largest chains dominated much of the landscape in 2021, recovery has now given way to innovation. From legacy brands to upstarts, this group of 50 chains fell outside of this year’s QSR 50, but will look to break through in the coming years.
CHECK OUT THE FULL QSR 50 RANKINGS
READ LAST YEAR’S CONTENDERS LIST
All information in this story, except for where * is indicated, was submitted directly to QSR magazine. The list is ranked by total systemwide sales from the pool of submissions. All data is year-end fiscal 2021.
Note: If viewing on desktop, please click the arrow in the picture to proceed.
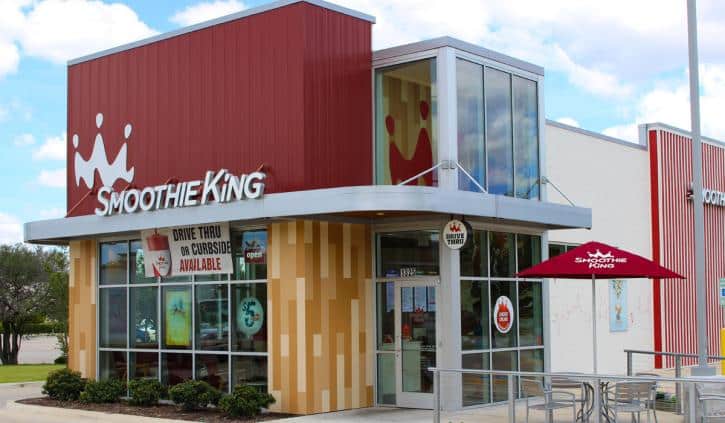
1. Smoothie King
U.S. systemwide sales (millions): $602
Average sales per unit (thousands): $609
Franchised stores: 1,302
Company stores: 56
2021 Total Units: 1,360
Total change in units from 2020: 55
Click here for a free download of the entire QSR 50 and brand-by-brand breakdown.
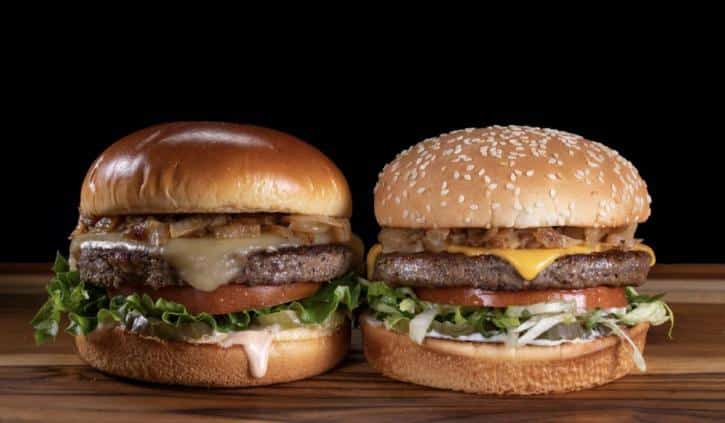
2. Habit Burger
U.S. systemwide sales (millions): $600
Average sales per unit (thousands): $2,030
Franchised stores: 31
Company stores: 276
2021 Total Units: 307
Total change in units from 2020: 29
Click here for a free download of the entire QSR 50 and brand-by-brand breakdown.
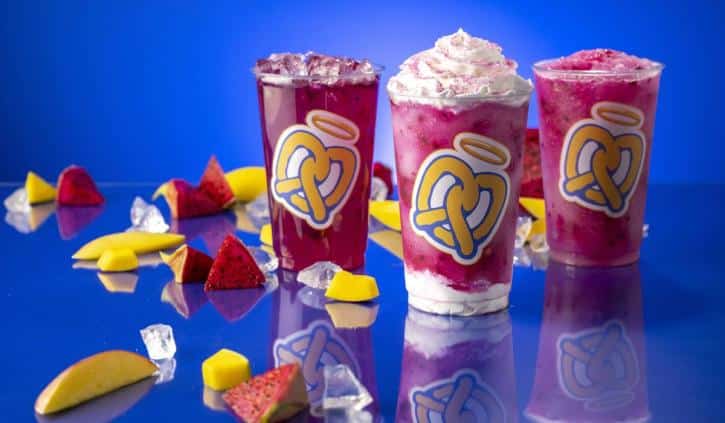
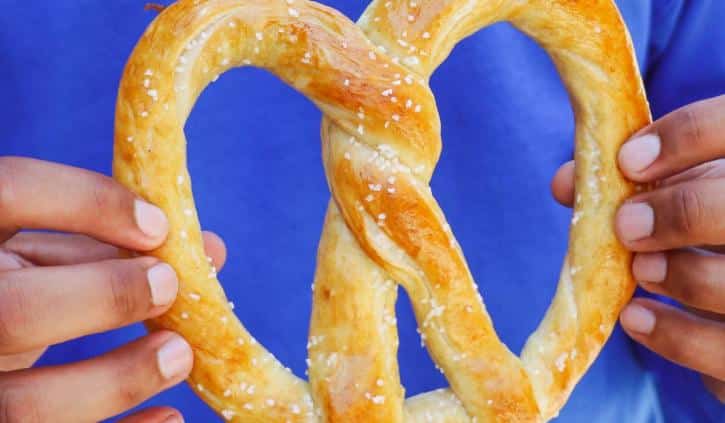
3. Auntie Anne’s
U.S. systemwide sales (millions): $576
Average sales per unit (thousands): $637
Franchised stores: 1,126
Company stores: 12
2021 Total Units: 1,138
Total change in units from 2020: –14
Click here for a free download of the entire QSR 50 and brand-by-brand breakdown.
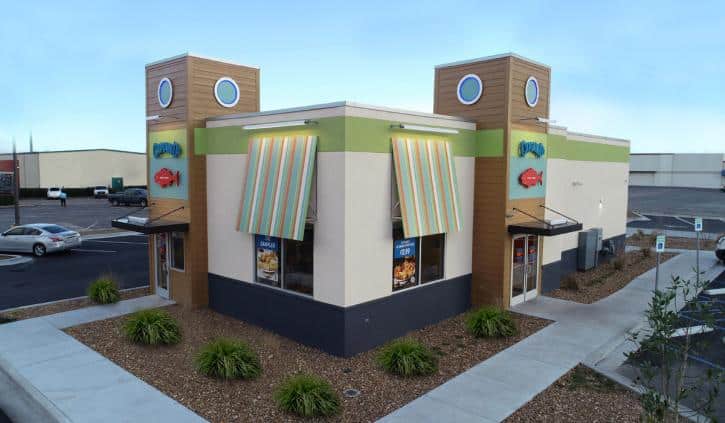
4. Captain D’s
U.S. systemwide sales (millions): $567
Average sales per unit (thousands): $1,094
Franchised stores: 294
Company stores: 242
2021 Total Units: 531
Total change in units from 2020: 2
Click here for a free download of the entire QSR 50 and brand-by-brand breakdown.
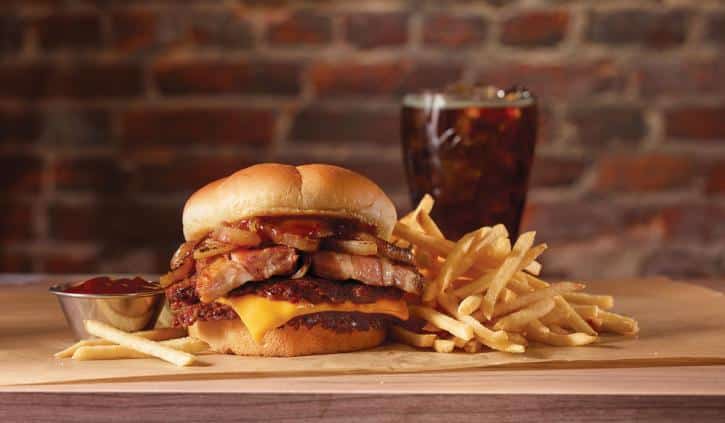
5. Steak ‘n Shake
U.S. systemwide sales (millions): $539
Average sales per unit (thousands): $1,764
Franchised stores: 337
Company stores: 199
2021 Total Units: 536
Total change in units from 2020: -20
Click here for a free download of the entire QSR 50 and brand-by-brand breakdown.
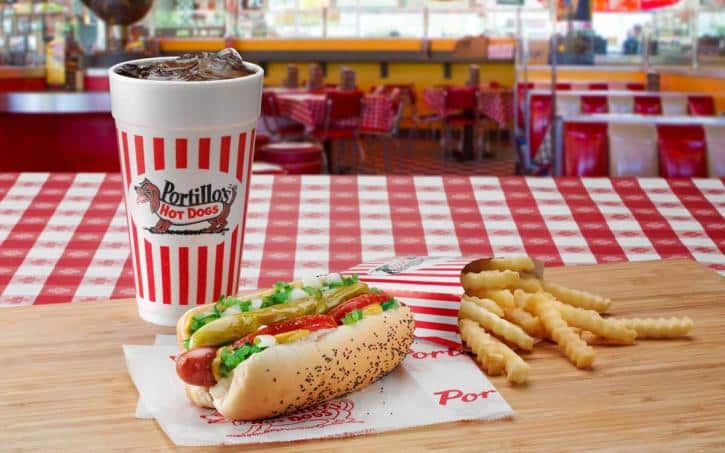
6. Portillo’s*
U.S. systemwide sales (millions): $526
Average sales per unit (thousands): $7,900
Franchised stores: 0
Company stores: 69
2021 Total Units: 69
Total change in units from 2020: 5
Click here for a free download of the entire QSR 50 and brand-by-brand breakdown.
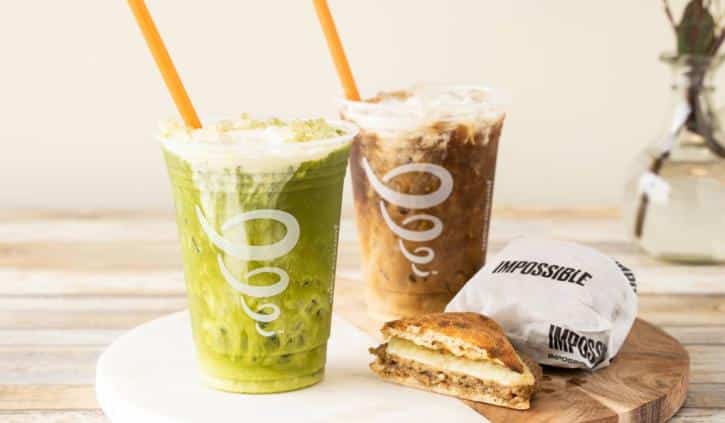
7. Jamba
U.S. systemwide sales (millions): $505
Average sales per unit (thousands): $754
Franchised stores: 747
Company stores: 3
2021 Total Units: 750
Total change in units from 2020: -17
Click here for a free download of the entire QSR 50 and brand-by-brand breakdown.
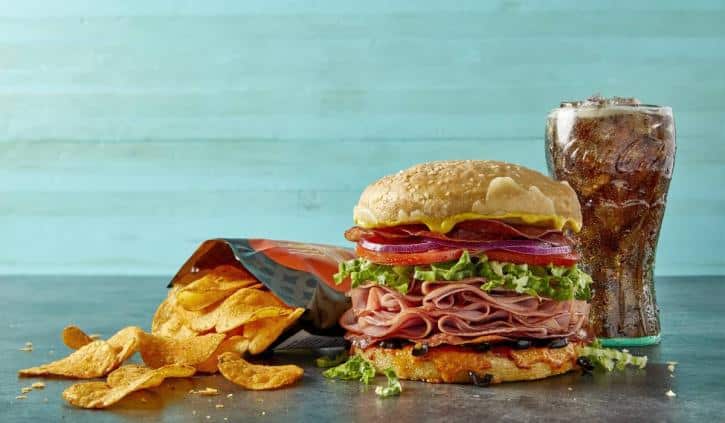
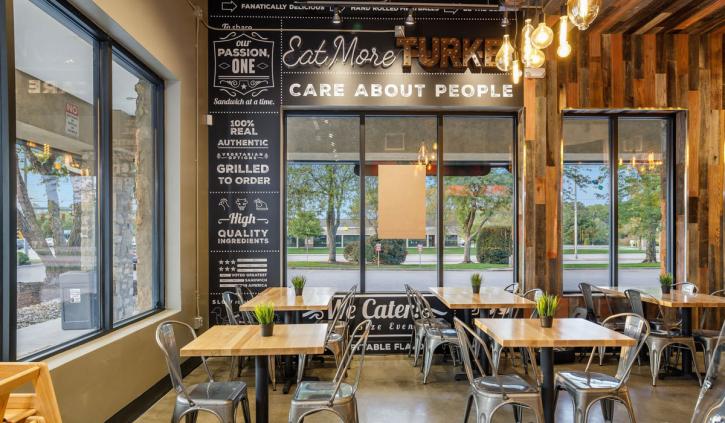
8. Schlotzsky’s
U.S. systemwide sales (millions): $332
Average sales per unit (thousands): $1,090
Franchised stores: 300
Company stores: 24
2021 Total Units: 324
Total change in units from 2020: -9
Click here for a free download of the entire QSR 50 and brand-by-brand breakdown.
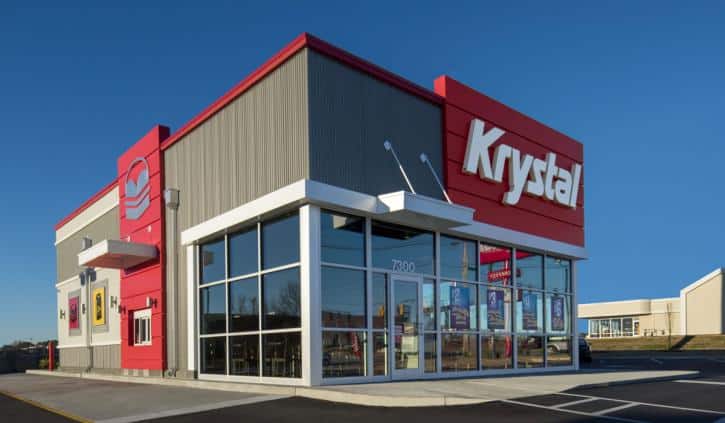
9. Krystal
U.S. systemwide sales (millions): $323
Average sales per unit (thousands): $1,126
Franchised stores: 105
Company stores: 182
2021 Total Units: 287
Total change in units from 2020: 3
Click here for a free download of the entire QSR 50 and brand-by-brand breakdown.
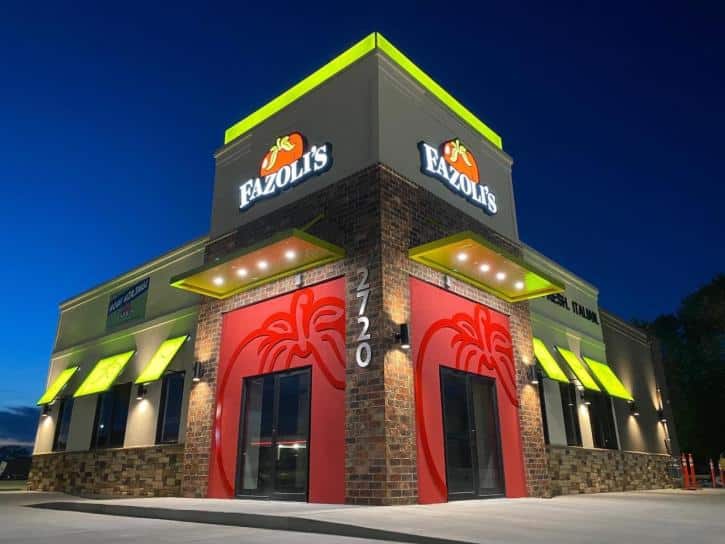
10. Fazoli’s
U.S. systemwide sales (millions): $298
Average sales per unit (thousands): $1,454
Franchised stores: 156
Company stores: 57
2021 Total Units: 213
Total change in units from 2020: 3
Click here for a free download of the entire QSR 50 and brand-by-brand breakdown.
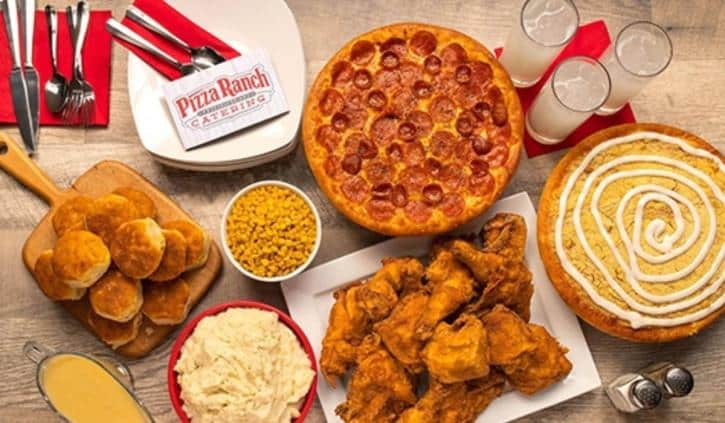
11. Pizza Ranch
U.S. systemwide sales (millions): $279
Average sales per unit (thousands): $1,312
Franchised stores: 207
Company stores: 6
2021 Total Units: 213
Total change in units from 2020: 2
Click here for a free download of the entire QSR 50 and brand-by-brand breakdown.
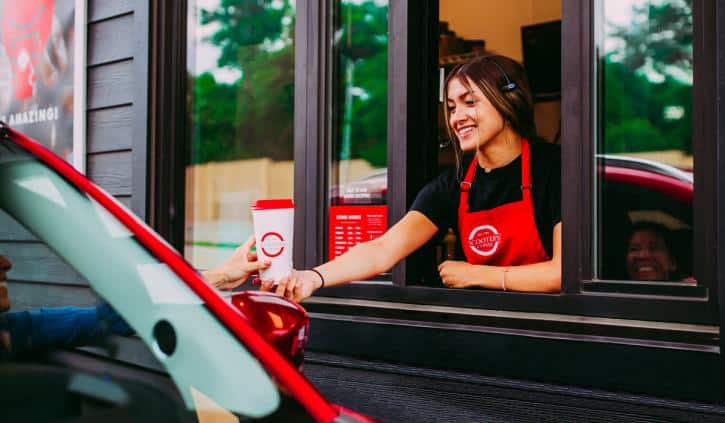
12. Scooter’s Coffee
U.S. systemwide sales (millions): $263
Average sales per unit (thousands): $801
Franchised stores: 379
Company stores: 21
2021 Total Units: 400
Total change in units from 2020: 92
Click here for a free download of the entire QSR 50 and brand-by-brand breakdown.
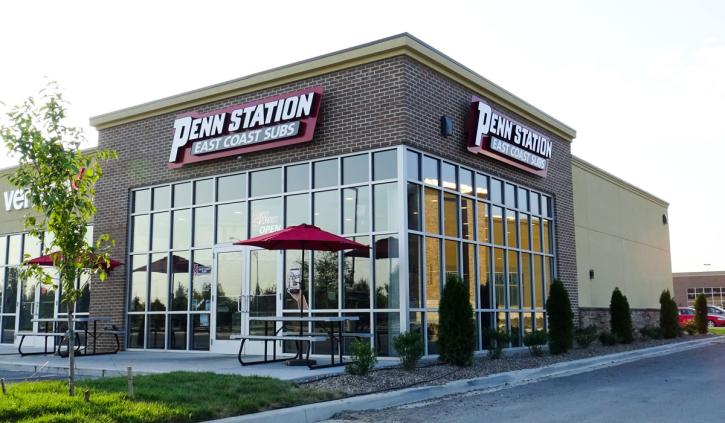
13. Penn Station
U.S. systemwide sales (millions): $258
Average sales per unit (thousands): $820
Franchised stores: 311
Company stores: 1
2021 Total Units: 312
Total change in units from 2020: 2
Click here for a free download of the entire QSR 50 and brand-by-brand breakdown.
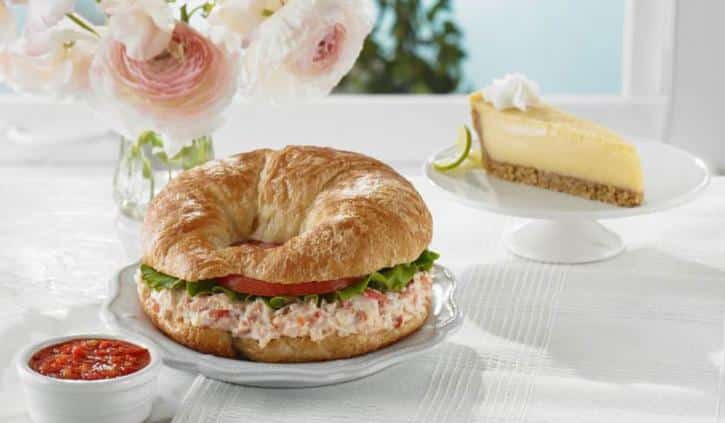
14. Chicken Salad Chick
U.S. systemwide sales (millions): $255
Average sales per unit (thousands): $1,293
Franchised stores: 150
Company stores: 55
2021 Total Units: 205
Total change in units from 2020: 29
Click here for a free download of the entire QSR 50 and brand-by-brand breakdown.
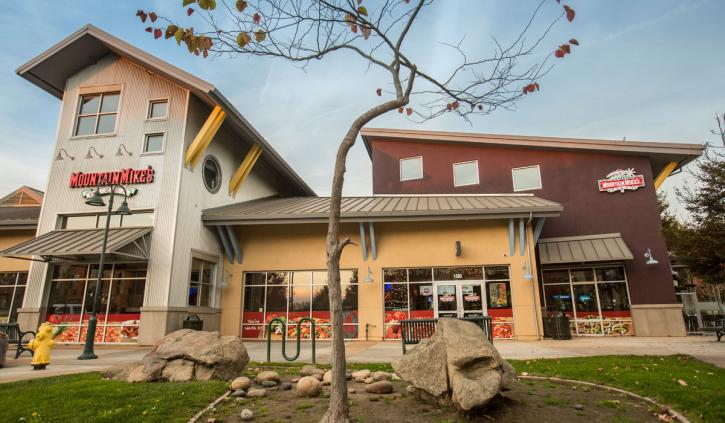
15. Mountain Mike’s
U.S. systemwide sales (millions): $254
Average sales per unit (thousands): $1,083
Franchised stores: 246
Company stores: 0
2021 Total Units: 246
Total change in units from 2020: 18
Click here for a free download of the entire QSR 50 and brand-by-brand breakdown.
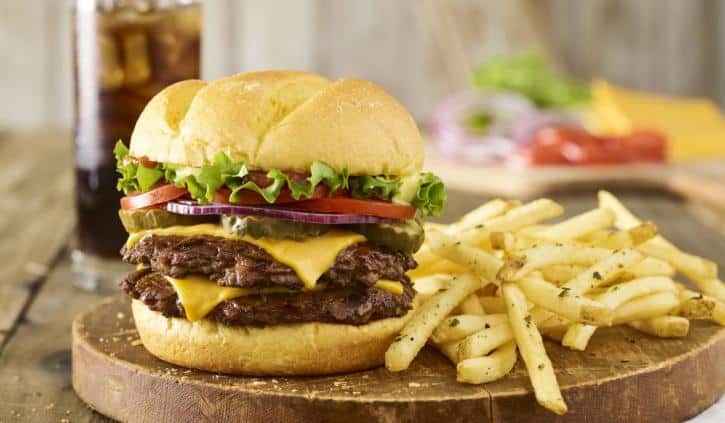
16. Smashburger
U.S. systemwide sales (millions): $253
Average sales per unit (thousands): $3,331
Franchised stores: 128
Company stores: 117
2021 Total Units: 245
Total change in units from 2020: 9
Click here for a free download of the entire QSR 50 and brand-by-brand breakdown.
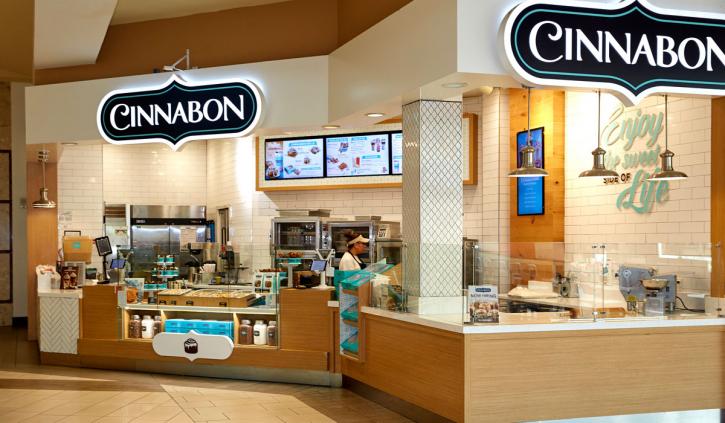
17. Cinnabon
U.S. systemwide sales (millions): $224
Average sales per unit (thousands): $637
Franchised stores: 938
Company stores: 1
2021 Total Units: 939
Total change in units from 2020: 2
Click here for a free download of the entire QSR 50 and brand-by-brand breakdown.
18. Wetzel’s
U.S. systemwide sales (millions): $219
Average sales per unit (thousands): $702
Franchised stores: 300
Company stores: 34
2021 Total Units: 351
Total change in units from 2020: 7
Click here for a free download of the entire QSR 50 and brand-by-brand breakdown.
19. Donatos
U.S. systemwide sales (millions): $211
Average sales per unit (thousands): $1,249
Franchised stores: 117
Company stores: 52
2021 Total Units: 169
Total change in units from 2020: 1
Click here for a free download of the entire QSR 50 and brand-by-brand breakdown.
20. Newk’s
U.S. systemwide sales (millions): $208
Average sales per unit (thousands): $2,056
Franchised stores: 87
Company stores: 18
2021 Total Units: 105
Total change in units from 2020: 5
Click here for a free download of the entire QSR 50 and brand-by-brand breakdown.
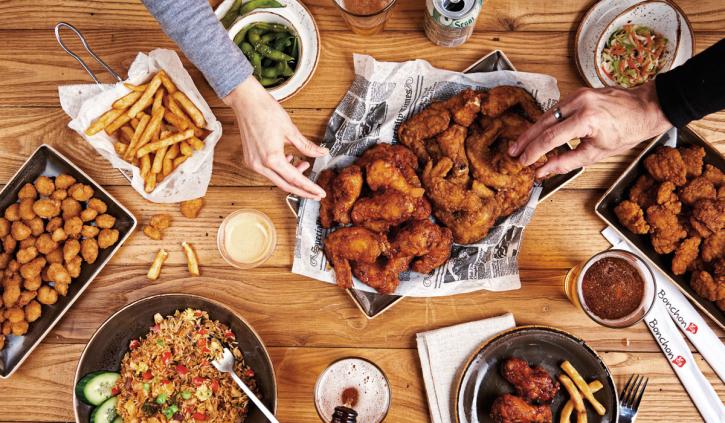
21. Bonchon
U.S. systemwide sales (millions): $173
Average sales per unit (thousands): $1,594
Franchised stores: 111
Company stores: 4
2021 Total Units: 115
Total change in units from 2020: 8
Click here for a free download of the entire QSR 50 and brand-by-brand breakdown.
22. Waba Grill
U.S. systemwide sales (millions): $170
Average sales per unit (thousands): $900
Franchised stores: 184
Company stores: 5
2021 Total Units: 189
Total change in units from 2020: 0
Click here for a free download of the entire QSR 50 and brand-by-brand breakdown.
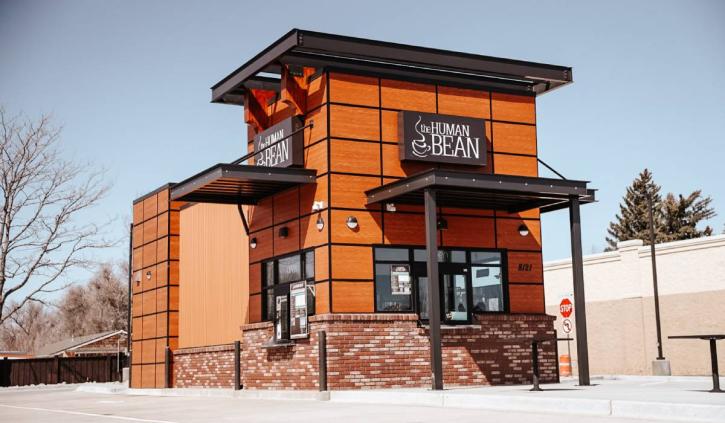
23. The Human Bean
U.S. systemwide sales (millions): $109
Average sales per unit (thousands): $916
Franchised stores: 116
Company stores: 13
2021 Total Units: 129
Total change in units from 2020: 16
Click here for a free download of the entire QSR 50 and brand-by-brand breakdown.
24. Capriotti’s
U.S. systemwide sales (millions): $108
Average sales per unit (thousands): $933
Franchised stores: 155
Company stores: 13
2021 Total Units: 169
Total change in units from 2020: 55
Click here for a free download of the entire QSR 50 and brand-by-brand breakdown.
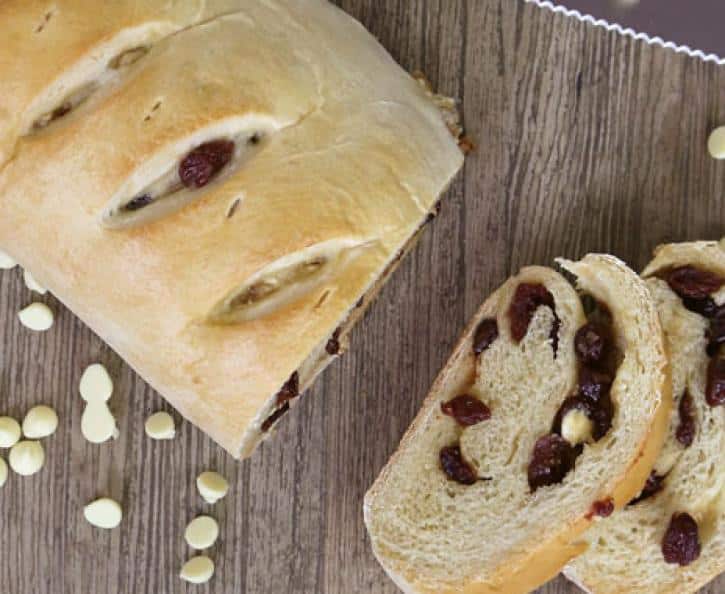
25. Great Harvest Bread Company
U.S. systemwide sales (millions): $108
Average sales per unit (thousands): $634
Franchised stores: 169
Company stores: 1
2021 Total Units: 170
Total change in units from 2020: –3
Click here for a free download of the entire QSR 50 and brand-by-brand breakdown.
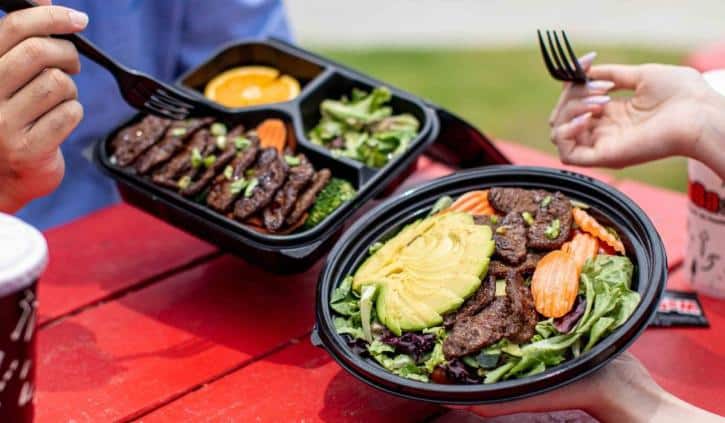
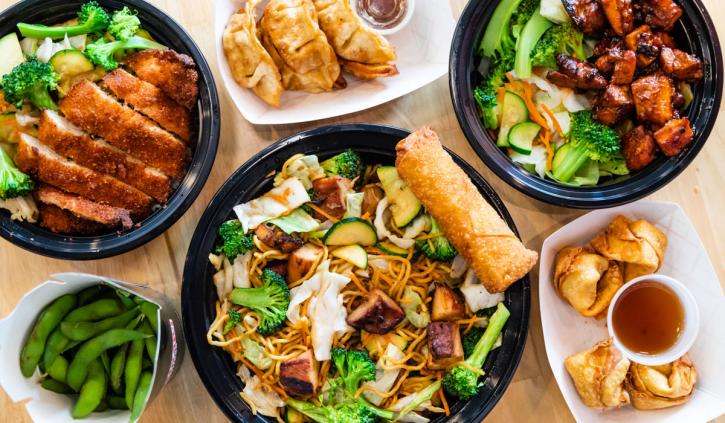
26. Teriyaki Madness
U.S. systemwide sales (millions): $90
Average sales per unit (thousands): $1,161
Franchised stores: 100
Company stores: 1
2021 Total Units: 101
Total change in units from 2020: 17
Click here for a free download of the entire QSR 50 and brand-by-brand breakdown.
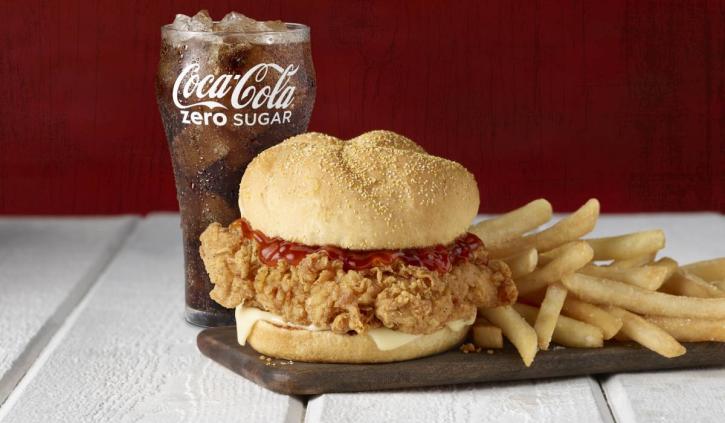
27. Roy Rogers
U.S. systemwide sales (millions): $82
Average sales per unit (thousands): $1,813
Franchised stores: 17
Company stores: 25
2021 Total Units: 42
Total change in units from 2020: –7
Click here for a free download of the entire QSR 50 and brand-by-brand breakdown.
28. Pizza Guys
U.S. systemwide sales (millions): $79
Average sales per unit (thousands): $1,102
Franchised stores: 68
Company stores: 7
2021 Total Units: 75
Total change in units from 2020: 5
Click here for a free download of the entire QSR 50 and brand-by-brand breakdown.
29. MOOYAH
U.S. systemwide sales (millions): $71
Average sales per unit (thousands): $866
Franchised stores: 88
Company stores: 1
2021 Total Units: 89
Total change in units from 2020: 5
Click here for a free download of the entire QSR 50 and brand-by-brand breakdown.
30. Salsarita’s
U.S. systemwide sales (millions): $68
Average sales per unit (thousands): $1,219
Franchised stores: 47
Company stores: 9
2021 Total Units: 56
Total change in units from 2020: 56
Click here for a free download of the entire QSR 50 and brand-by-brand breakdown.
31. Dog Haus
U.S. systemwide sales (millions): $67
Average sales per unit (thousands): $1,653
Franchised stores: 49
Company stores: 2
2021 Total Units: 51
Total change in units from 2020: 13
Click here for a free download of the entire QSR 50 and brand-by-brand breakdown.
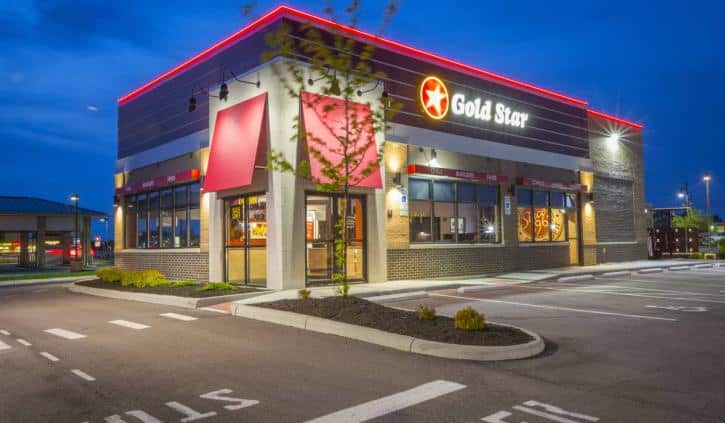
32. Gold Star Chili
U.S. systemwide sales (millions): $61
Average sales per unit (thousands): $958
Franchised stores: 60
Company stores: 7
2021 Total Units: 67
Total change in units from 2020: –5
Click here for a free download of the entire QSR 50 and brand-by-brand breakdown.
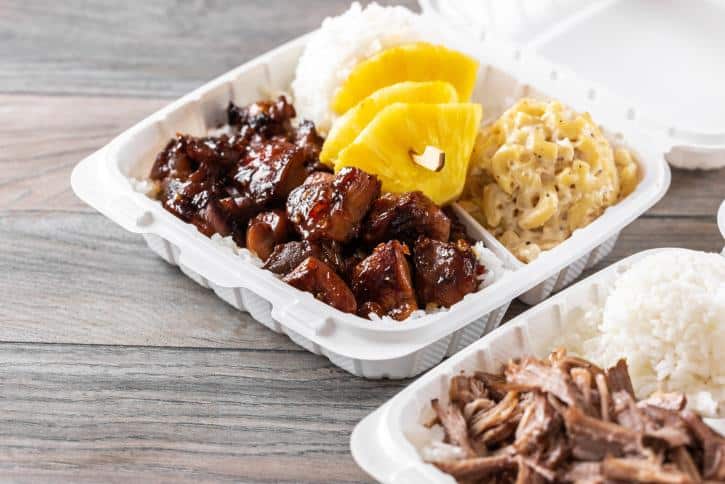
33. Hawaiian Bros
U.S. systemwide sales (millions): $55
Average sales per unit (thousands): $4,400
Franchised stores: 0
Company stores: 26
2021 Total Units: 26
Total change in units from 2020: 17
Click here for a free download of the entire QSR 50 and brand-by-brand breakdown.
34. Honeygrow
U.S. systemwide sales (millions): $55
Average sales per unit (thousands): $2,300
Franchised stores: 0
Company stores: 25
2021 Total Units: 25
Total change in units from 2020: 1
Click here for a free download of the entire QSR 50 and brand-by-brand breakdown.
35. Robeks
U.S. systemwide sales (millions): $50
Average sales per unit (thousands): $1,093
Franchised stores: 85
Company stores: 1
2021 Total Units: 86
Total change in units from 2020: 3
Click here for a free download of the entire QSR 50 and brand-by-brand breakdown.
36. PJ’s Coffee of New Orleans
U.S. systemwide sales (millions): $46
Average sales per unit (thousands): $454
Franchised stores: 130
Company stores: 11
2021 Total Units: 141
Total change in units from 2020: 17
Click here for a free download of the entire QSR 50 and brand-by-brand breakdown.
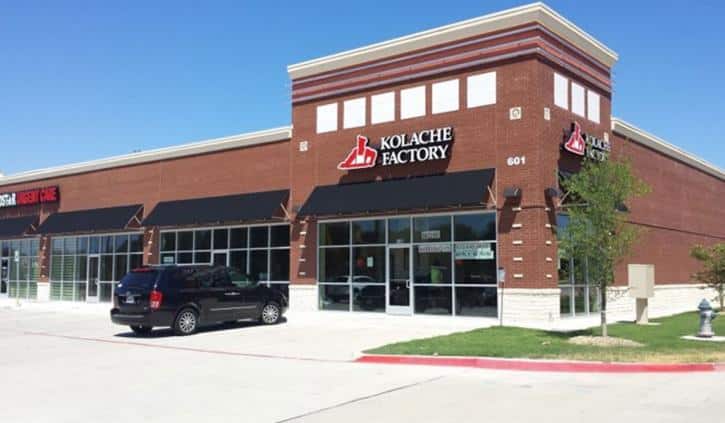
37. Kolache Factory
U.S. systemwide sales (millions): $46
Average sales per unit (thousands): $454
Franchised stores: 30
Company stores: 29
2021 Total Units: 59
Total change in units from 2020: 2
Click here for a free download of the entire QSR 50 and brand-by-brand breakdown.
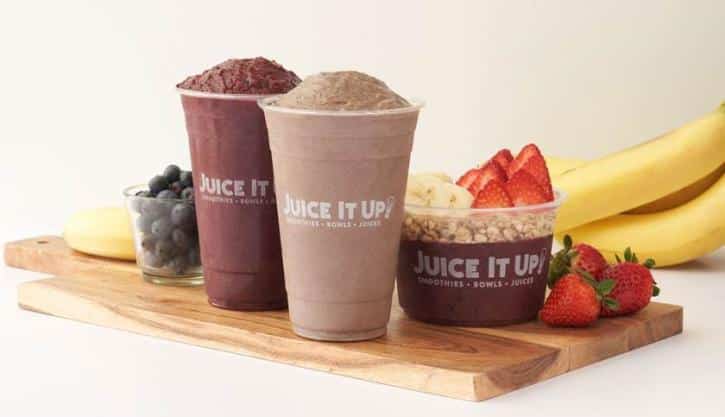
38. Juice it Up!
U.S. systemwide sales (millions): $43
Average sales per unit (thousands): $575
Franchised stores: 78
Company stores: 1
2021 Total Units: 79
Total change in units from 2020: 0
Click here for a free download of the entire QSR 50 and brand-by-brand breakdown.
39. Happy Joe’s
U.S. systemwide sales (millions): $38
Average sales per unit (thousands): $985
Franchised stores: 36
Company stores: 9
2021 Total Units: 45
Total change in units from 2020: 1
Click here for a free download of the entire QSR 50 and brand-by-brand breakdown.
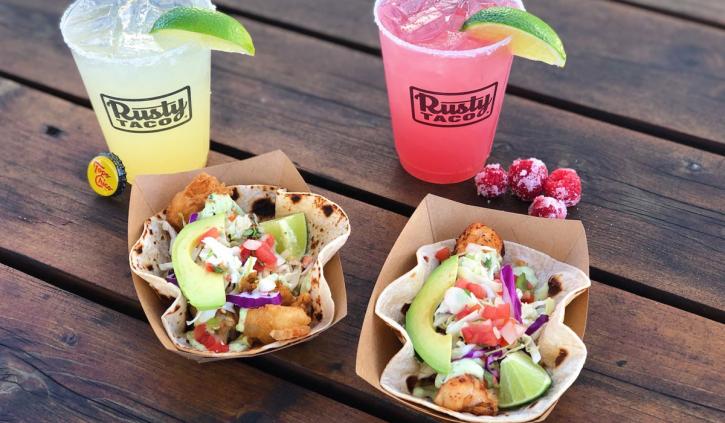
40. Rusty Taco
U.S. systemwide sales (millions): $35
Average sales per unit (thousands): $988
Franchised stores: 37
Company stores: 5
2021 Total Units: 42
Total change in units from 2020: 6
Click here for a free download of the entire QSR 50 and brand-by-brand breakdown.
41. Wing Zone
U.S. systemwide sales (millions): $34
Average sales per unit (thousands): $1,001
Franchised stores: 34
Company stores: 0
2021 Total Units: 34
Total change in units from 2020: 4
Click here for a free download of the entire QSR 50 and brand-by-brand breakdown.
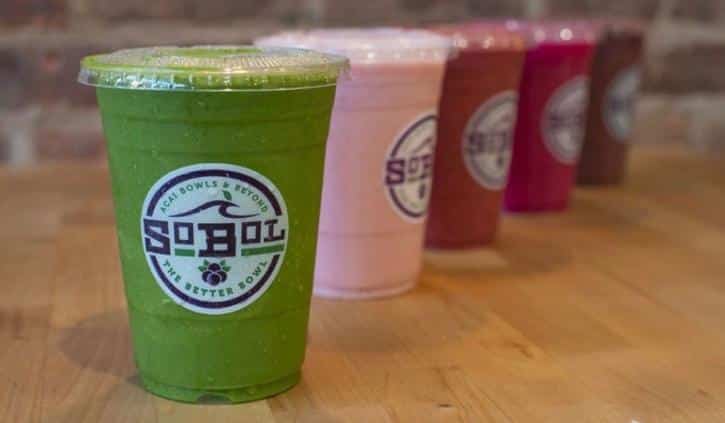
42. SoBol
U.S. systemwide sales (millions): $30
Average sales per unit (thousands): $594
Franchised stores: 55
Company stores: 3
2021 Total Units: 58
Total change in units from 2020: 8
Click here for a free download of the entire QSR 50 and brand-by-brand breakdown.
43. Swig
U.S. systemwide sales (millions): $29
Average sales per unit (thousands): $989
Franchised stores: 0
Company stores: 38
2021 Total Units: 38
Total change in units from 2020: 8
Click here for a free download of the entire QSR 50 and brand-by-brand breakdown.
44. Pickleman’s Gourmet Cafe
U.S. systemwide sales (millions): $29
Average sales per unit (thousands): $1,271
Franchised stores: 24
Company stores: 0
2021 Total Units: 24
Total change in units from 2020: 1
Click here for a free download of the entire QSR 50 and brand-by-brand breakdown.
45. Killer Burger
U.S. systemwide sales (millions): $17
Average sales per unit (thousands): $1,400
Franchised stores: 4
Company stores: 12
2021 Total Units: 16
Total change in units from 2020: 3
Click here for a free download of the entire QSR 50 and brand-by-brand breakdown.
46. Wing Snob
U.S. systemwide sales (millions): $15
Average sales per unit (thousands): $1,051
Franchised stores: 18
Company stores: 0
2021 Total Units: 18
Total change in units from 2020: 6
Click here for a free download of the entire QSR 50 and brand-by-brand breakdown.
47. Bad Ass Coffee of Hawaii
U.S. systemwide sales (millions): $12
Average sales per unit (thousands): $720
Franchised stores: 20
Company stores: 0
2021 Total Units: 20
Total change in units from 2020: 0
Click here for a free download of the entire QSR 50 and brand-by-brand breakdown.
48. Asian Box
U.S. systemwide sales (millions): $11
Average sales per unit (thousands): $1,500
Franchised stores: 0
Company stores: 8
2021 Total Units: 8
Total change in units from 2020: –2
Click here for a free download of the entire QSR 50 and brand-by-brand breakdown.
49. Sauce on the Side
U.S. systemwide sales (millions): $9
Average sales per unit (thousands): $1,053
Franchised stores: 6
Company stores: 3
2021 Total Units: 9
Total change in units from 2020: 1
Click here for a free download of the entire QSR 50 and brand-by-brand breakdown.
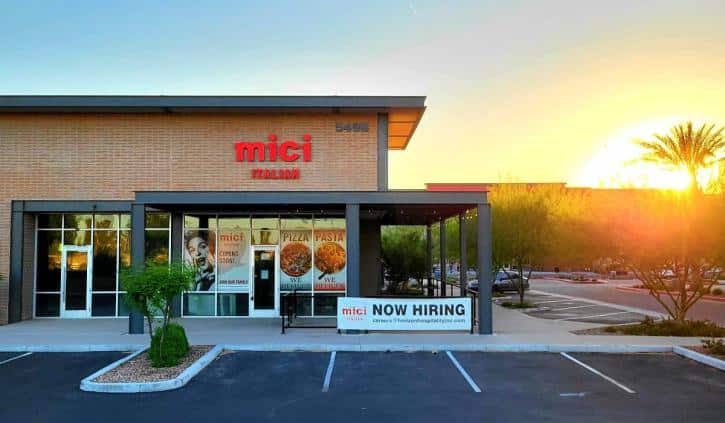
50. Mici Italian
U.S. systemwide sales (millions): $7
Average sales per unit (thousands): $1,204
Franchised stores: 0
Company stores: 7
2021 Total Units: 7
Total change in units from 2020: 2
Click here for a free download of the entire QSR 50 and brand-by-brand breakdown.


