From the restaurant view, inflation isn’t curbing. Menu prices bumped 8 percent, year-over-year, in August, which marked the highest leap of 2022 thus far (June previously held that title at 7.7 percent). Figures climbed 9 percent in full service and 7.2 percent for counter-serves.
There are various factors pushing prices higher, from demand-driven inflation to what it costs to retain and recruit. And where that evolves next is difficult to pin down.
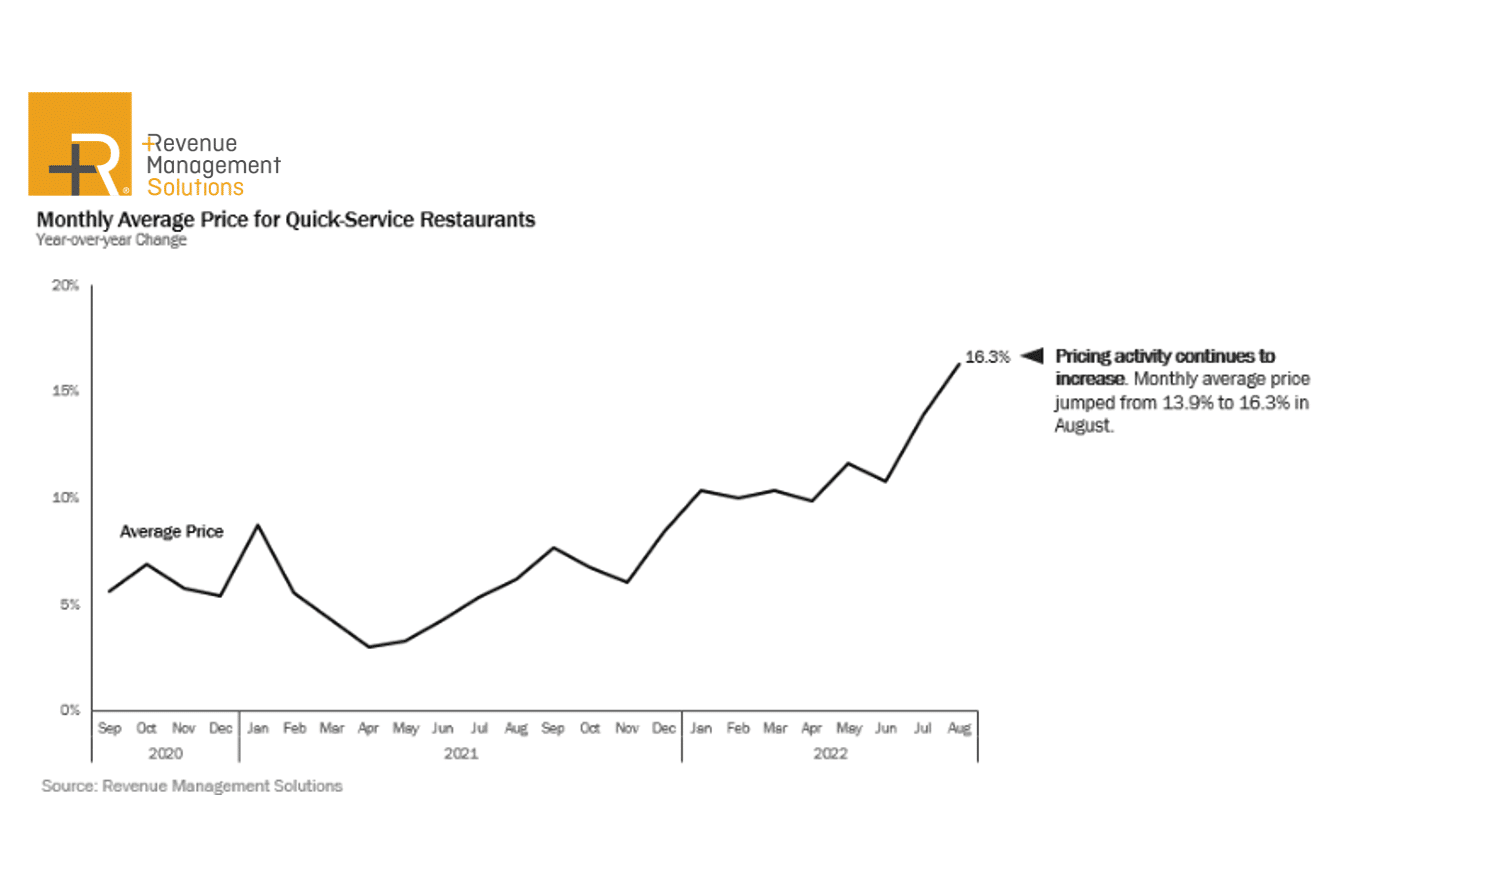
But what we can examine today is the consumer kickback. Revenue Management Solutions has tracked sentiment throughout the pandemic. Its latest dive backs federal data. Based on quick-service results, average price in August was 16.3 percent higher than a year ago—a 3 percentage point jump from July’s 13.9 percent and the most significant uptick since September 2020.
Meanwhile, basket size continued to decline (negative 5.3 percent, year-over-year), indicating consumers are limiting restaurant spending. Per RMS’ most recent survey, the cohort most responsible is Baby Boomers. Forty-eight percent said they were cutting back on restaurants and one in two reported getting less value due to pricing and shrinkflation. Millennials had the most positive perspective, with just one in four feeling they were receiving less value. It was 38 percent for Gen X and 30 percent for Gen Z.
Why these generations felt they were being shorted differed, too.

Read here for more on the inflation response, by generation.
Net industry sales in August were positive at 5.2 percent despite traffic declining 4.4 percent, year-over-year. By now, this is a familiar spin: fewer visits countered by higher average check (10.1 percent in August).
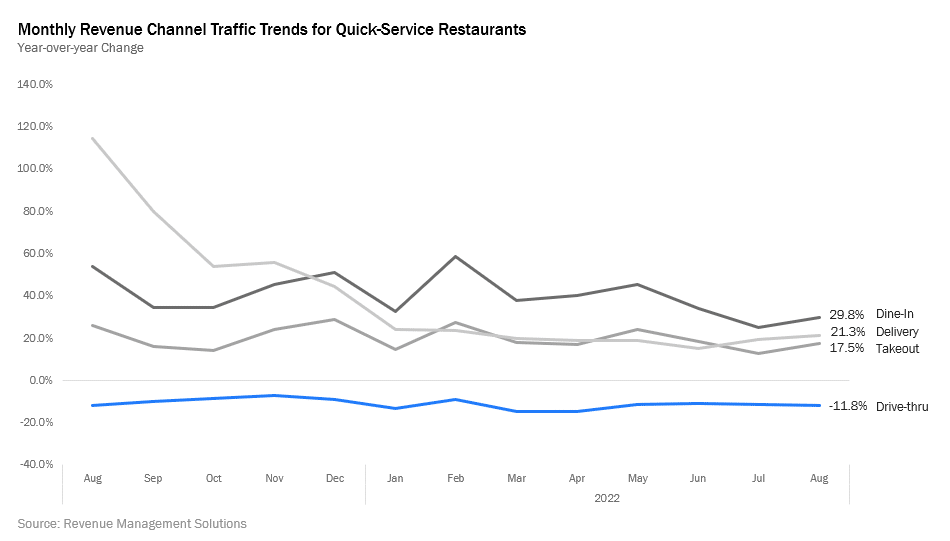
Drive-thru traffic was down 11.8 percent in August, but has begun to stabilize month-over-month, as the below chart shows. It’s a reflection of dine-in’s comeback as much as anything else. The arena today is more normalized versus the days when drive-thru consumed market share amid lockdowns.
Yet the current and future look of drive-thru remains elevated versus pre-COVID. In RMS’ survey, 31 percent of millennials and 29 percent of Gen Z-ers said they intended to increase drive-thru visits more or much more in the future. It is also worth highlighting traffic continues to comp against summer 2021 levels when mass vaccination efforts created a surge in restaurant visits.

Dine-in (29.8 percent), delivery (21.3 percent), and takeout (17.5 percent) are all performing better over 2021. Millennials are jumping delivery usage in comparison to other generations; 84 percent reported ordering delivery at least once a week. Gen Z-ers were not far behind at 69 percent.
On the daypart side, breakfast has leveled out, down only 0.6 percent compared to August 2021 and up slightly month-over-month. Lunch, thanks to an ever-evolving world of flexible workplaces, was 5.5 percent lower, year-over-year.

Into the changes
Customer arrival platform Bluedot’s State of What Feeds Us report dates back nearly three years at this point. The seventh installation, released Thursday, uncovered shifts in habits tied to the various points referenced above. Naturally, the biggest one in motion was inflation.
Bluedot’s research suggested growing demand for deals and offers as well as value menus; three in four respondents admitted looking for discounts more often these days. Two in three were downloading restaurant apps or loyalty programs to find deals and freebies. Dinner deals (generally a more expensive trip) were more popular than discounts and offers for breakfast and lunch.
“With high inflation, it’s not surprising to see sweeping shifts in consumer restaurant habits. Increasing demand for priced-right menus via value deals, discounts, and offers certainly presents an opportunity for businesses to not only woo customers but also nurture them into repeat customers, especially through apps and loyalty programs,” says Judy Chan, CMO of Bluedot. “At the same time, companies should be very cautious about over adjustments to portion sizes. Consumers are clearly aware of shrinkflation and it could very well have a longer term, consequential impact on brand perception.”
“Shrinkflation” pulsed in Bluedot’s study as well, just as it did with RMS. Guests are looking for it and wise to the tactic—77 percent said they noticed they’re paying the same amount for smaller portion sizes.
Eighty-three percent, on an overall look, reported changing habits due to price lifts. This included cutting down on fast food (46 percent), ordering less expensive items (37 percent), ordering fewer items (32 percent), visiting restaurants that are closer due to gas prices (20 percent), and eating more fast food (14 percent).
Ninety-one percent said they’ve recognized pricing increases at restaurants, up from 85 percent in October 2021.
Seventy-three percent of respondents added they’re ordering from value menus more often in response. Of those, 31 percent added that although they’re doing so, they’d prefer not to.
How it breaks down:
- 73 percent: Consumers ordering off value menus more often due to costs
Divided by:
- 42 percent: Ordering off the value menu due to cost increases
- 31 percent: Ordering off the value menu, but prefer not to
Consumers reported cutting back on visits to sit-down restaurants (50 percent), coffee chains (47 percent), and fast casual (43 percent).
The most insulated segments were independent coffee houses (only 27 percent cut back) and C-stores (24 percent).
And why: 31 percent credited fuel costs and 27 percent “less money.”
Returning to the value hunt, three-quarters noted they were looking for fast-food deals more often in today’s inflationary climate. Half are seeing more deals and offers at the restaurants they frequent.
Two-thirds are downloading more apps or joining additional loyalty programs to access offers. Within that set, 31 percent said they’re downloading more apps, 32 percent are joining more loyalty programs, and 36 percent are doing both.
Fifty-three percent of respondents were most likely to look for deals and coupons for dinner compared to lunch (36 percent), breakfast (8 percent), or a snack (3 percent). For Gen Z, coupons and deals for lunch proved most popular.
Top ways consumers find coupons and deals:
- Restaurant app: 51 percent
- Coupons in the mail: 43 percent
- On the menuboard: 30 percent
- Social media: 29 percent (this number was 44 percent for Gen Z).
- Email: 27 percent
- Restaurant website: 26 percent
A java jolt
For the first time, Bluedot examined consumer behavior around coffee chains. It found shorter drive-thru lines are luring guests away from their go-to fast-food spots. And not just that—one in two consumers felt coffee chain drive-thrus were faster. The data also signaled they were buying a lot more than coffee, with 53 percent saying they consider visiting a coffee chain when they’re really hungry, often without a coffee purchase. Of those, 41 percent will consider getting food at a java brand without a coffee purchase while 59 percent will only attach food to their beverage order.
Two-thirds of consumers were willing to make separate stops at fast-food restaurants and coffee chains. In that mix, 61 percent would consider it while 39 percent already are already doing so.
Essentially, the promise of a quicker experience is resonating. Six in 10 consumers considered buying food at a coffee chain if other drive-thrus have a long line. Of the six, two already do.
And high-income guests are headed to coffee brands for a quick bite. Sixty-eight percent of this group said they were more likely to visit coffee chains for a snack compared to middle-income earners (49 percent) and lower-income earners (54 percent).
Mirroring trends reported by cold-drink fueled chains like Starbucks and Dunkin’, afternoon and daily deals are bringing people in.
Top reasons why consumers said they were more likely to visit a coffee chain after the morning rush: afternoon deals (46 percent), daily deals (43 percent), short drive-thru lines (32 percent), a snack (28 percent), a meal (26 percent), want another coffee or specialty drink (25 percent), and fast and easy to mobile order (20 percent).
“Wait time has always been key to successful drive-thru experiences; an element brands have taken seriously and this latest report is a strong reminder of that. Coffee chains with drive-thrus are very well positioned to pick off [quick-service] customers and it will be interesting to see how that plays out in the short and long term as more drive-thrus across categories emerge,” Chan says.
Digital, sustainability, and other trends
Bluedot noticed a 6 percent dip in mobile ordering over the last three months (35 percent reported placing more app orders than three months ago). That’s a downward result that hadn’t showed in previous studies. Among high-income earners, though, there was an increase.

Mobile order pickup has frustrated guests throughout the studies. One in three told Bluedot they weren’t willing to wait longer than 4 minutes. Twenty-two percent of those want a wait time sub 2 minutes.
Waiting continues to cause friction:
September 2022
- Order isn’t ready upon arrival: 42 percent
- Order is ready, but still need to wait: 40 percent
February 2022
- Order isn’t ready upon arrival: 50 percent
- Order is ready, but still need to wait: 50 percent
September 2021
- Order isn’t ready upon arrival: 46 percent
- Order is ready, but still need to wait: 44 percent
Pain points with mobile pickup: order isn’t ready upon arrival and still having to wait (42 percent), having to wait even though order is ready (40 percent), inaccurate orders (39 percent), food is cold (34 percent), and staff is preoccupied upon customer arrival (20 percent).
That latter result is a new one in Bluedot’s data, pulsing what’s been a rising issue during the industry’s melding of digital and in-store business—consumers feeling one is getting favored over the other, and the difficulty in staffing against that perception.
Like RMS’ data, drive-thru usage has begun to record a post-COVID baseline. Ninety-one percent of Bluedot respondents said they’ve visited a drive-thru in the past month. That number was 90 percent in February.
Customers visiting drive-thru last month:
- September 2022: 91 percent
- February 2022: 90 percent
- September 2021: 90 percent
- May 2021: 90 percent
- February 2021: 89 percent
- April 2020: 79 percent
In addition, Bluedot also posed some thoughts on sustainability. Three-quarters of respondents said they notice restaurants today claiming to be environmentally conscious. Nearly half, however, weren’t buying it. Consumers do want restaurants to engage—three in four were more likely to visit environmentally friendly restaurants. Yet, the ROI is complicated. Only one in three said they were willing to pay more for it.
Three in 10 respondents added they’ve tried plant-based menu items. Most (85 percent) noted they recognize fast-food restaurants as major contributors to the country’s food waste problem. Eight in 10 claimed they were more likely to visit a restaurant that took steps to compost or donate excess food.
Three in four guests said they were more likely to visit a restaurant that offers clean ingredients. One in three were willing to pay more to do so.