

The COVID pandemic has created an intense battle for quick-service market share.
Many of the biggest restaurants in fast-food are boasting about how excited their franchisees are.
“If you look back at the last five years, and if you look both in the pizza industry and the [quick-service restaurant] industry as far as actual number of net stores and percentage, Domino’s is a leader in that, and still with these numbers we’re going to continue to be a leader,” said Domino’s CEO Russell Weiner. “Also what I think that tells me is while we continue to lead in development, our franchisees are doing exactly what they need to do, which is balancing the capacity needs between the current stores they have and stores they need to open.”
Chains are pumped about their own growth, as well. Chipotle, which is completely company-owned, opened 42 stores in the second quarter. The fast casual has unit growth target of 8-10 percent annually, and it has the pipeline to do it. Eighty percent of locations in development are Chipotlanes, which come with higher AUV and margins.
Each year, the QSR 50 captures how the top players in fast food improve their footprint on an annual basis. The following is a ranking of the top 25 fastest growing chains in the U.S.
Check Out Past Results:
Other Related Lists:
The Top 50 Fast-Food Chains of 2021
The 50 Biggest Fast-Food Chains in America
These 32 Fast-Food Chains Earn the Most Per Restaurant
Note: The unit counts are by U.S. restaurants as of 2021 year end.
Note: If viewing on desktop, please click the arrow in the picture to continue. * Indicates estimate by QSR.
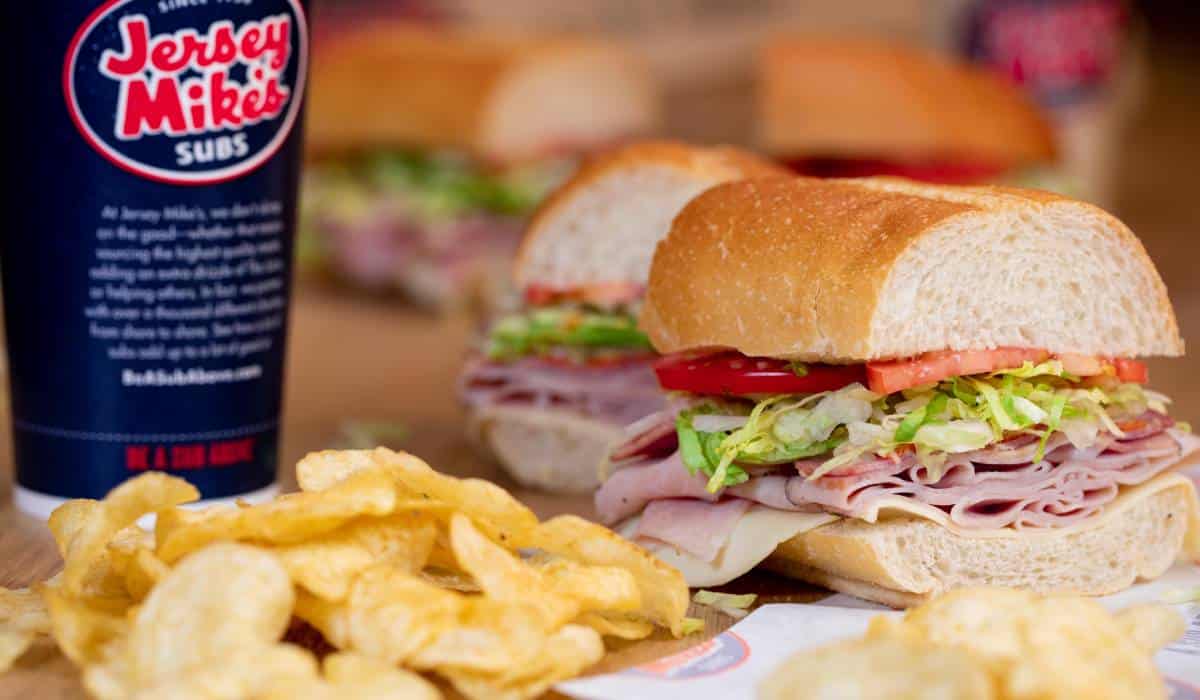
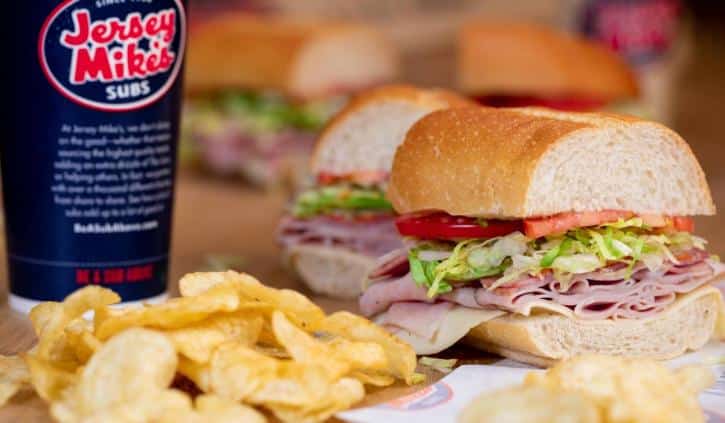
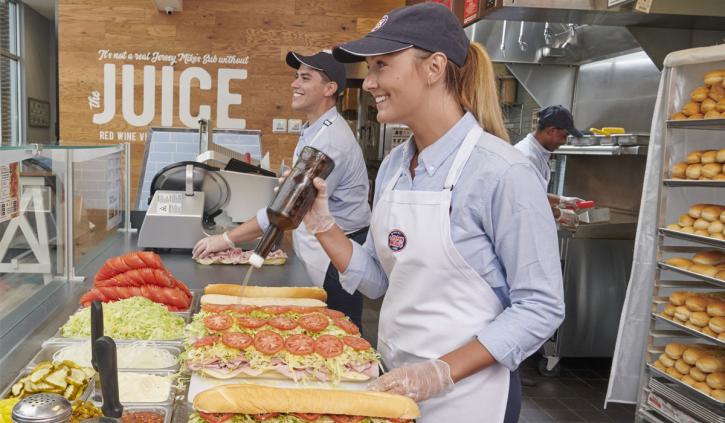
1. Jersey Mike’s
Total change in units from 2020: 246
2021 Total Units: 2,100
Franchised stores: 2,087
Company stores: 13
U.S. systemwide sales (millions): $2,203
Average sales per unit (thousands): $1,145
Click here for a free download of the entire QSR 50 and brand-by-brand breakdown.
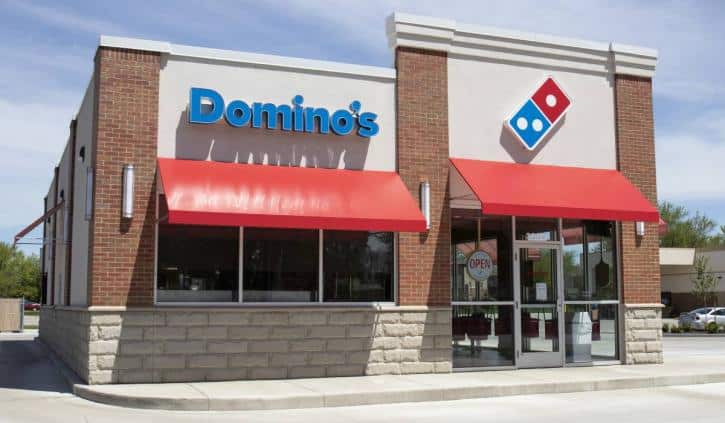
2. Domino’s
Total change in units from 2020: 205
2021 Total Units: 6,560
Franchised stores: 6,185
Company stores: 375
U.S. systemwide sales (millions): $8,641
Average sales per unit (thousands): $1,317
Click here for a free download of the entire QSR 50 and brand-by-brand breakdown.
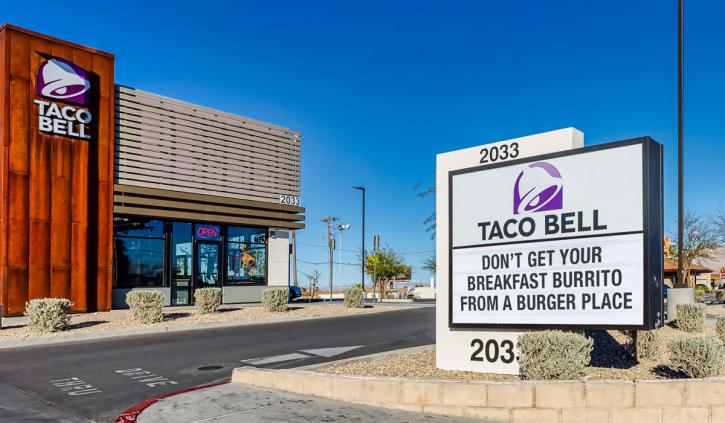
3. Taco Bell
Total change in units from 2020: 203
2021 Total Units: 7,002
Franchised stores: 6,540
Company stores: 462
U.S. systemwide sales (millions): $12,600
Average sales per unit (thousands): $1,823
Click here for a free download of the entire QSR 50 and brand-by-brand breakdown.
4. Chipotle
Total change in units from 2020: 198
2021 Total Units: 2,966
Franchised stores: 0
Company stores: 2,966
U.S. systemwide sales (millions): $7,547
Average sales per unit (thousands): $2,641
Click here for a free download of the entire QSR 50 and brand-by-brand breakdown.
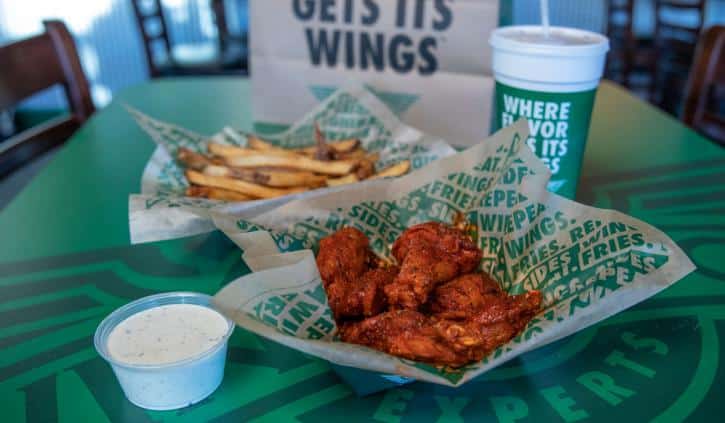
5. Wingstop*
Total change in units from 2020: 175
2021 Total Units: 1,534
Franchised stores: 1,498
Company stores: 36
U.S. systemwide sales (millions): $2,278
Average sales per unit (thousands): $1,592
Click here for a free download of the entire QSR 50 and brand-by-brand breakdown.
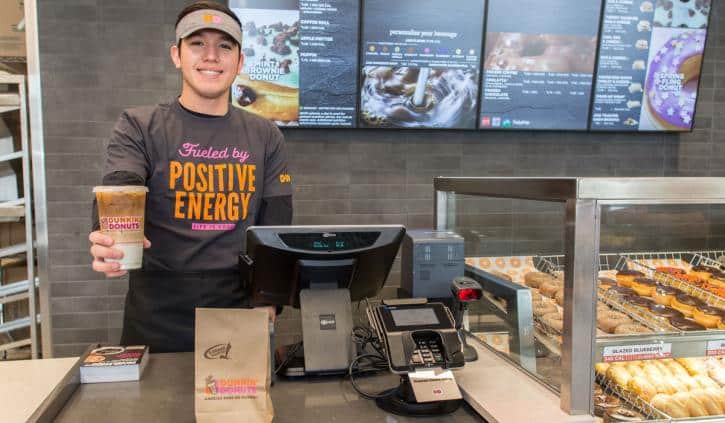
6. Dunkin’
Total change in units from 2020: 161
2021 Total Units: 9,244
Franchised stores: 9,244
Company stores: 0
U.S. systemwide sales (millions): $10,416
Average sales per unit (thousands): $1,127
Click here for a free download of the entire QSR 50 and brand-by-brand breakdown.
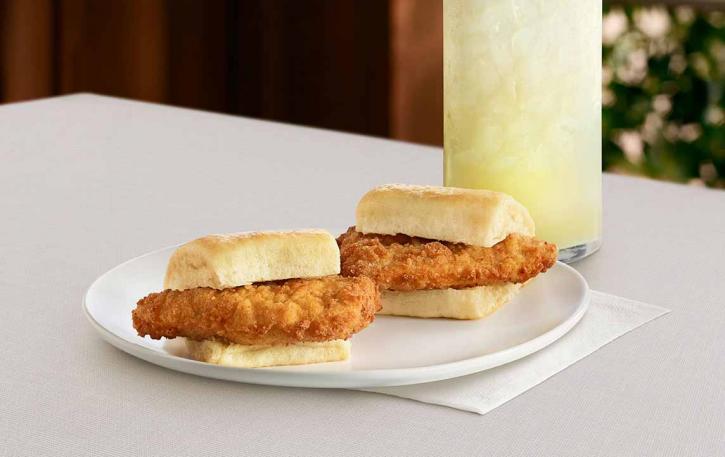
7. Chick-fil-A*
Total change in units from 2020: 155
2021 Total Units: 2,732
Franchised stores: 2,650
Company stores: 82
U.S. systemwide sales (millions): $16,700
Average sales per unit (thousands): $6,100
Click here for a free download of the entire QSR 50 and brand-by-brand breakdown.
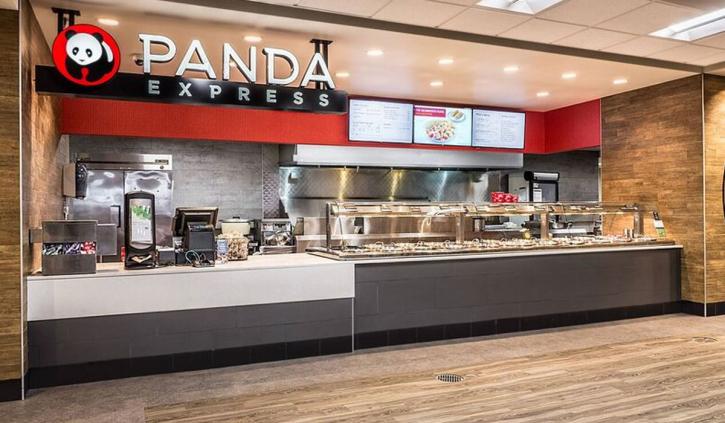
8. Panda Express
Total change in units from 2020: 150
2021 Total Units: 2,334
Franchised stores: 147
Company stores: 2,187
U.S. systemwide sales (millions): $4,452
Average sales per unit (thousands): $2,173
Click here for a free download of the entire QSR 50 and brand-by-brand breakdown.
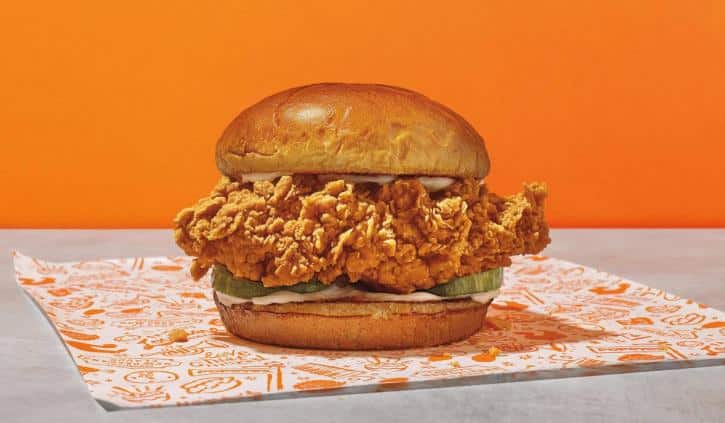
9. Popeyes Louisiana Kitchen
Total change in units from 2020: 146
2021 Total Units: 2,754
Franchised stores: 2,716
Company stores: 41
U.S. systemwide sales (millions): $4,775
Average sales per unit (thousands): $1,867
Click here for a free download of the entire QSR 50 and brand-by-brand breakdown.
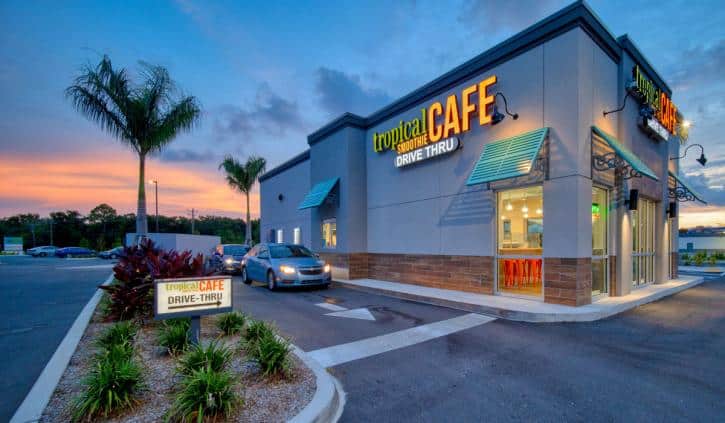
10. Tropical Smoothie Cafe
Total change in units from 2020: 125
2021 Total Units: 1,039
Franchised stores: 1,038
Company stores: 1
U.S. systemwide sales (millions): $948
Average sales per unit (thousands): $1,009
Click here for a free download of the entire QSR 50 and brand-by-brand breakdown.
11. Starbucks*
Total change in units from 2020: 113
2021 Total Units: 15,450
Franchised stores: 6,497
Company stores: 8,953
U.S. systemwide sales (millions): $24,300
Average sales per unit (thousands): $1,200
Click here for a free download of the entire QSR 50 and brand-by-brand breakdown.
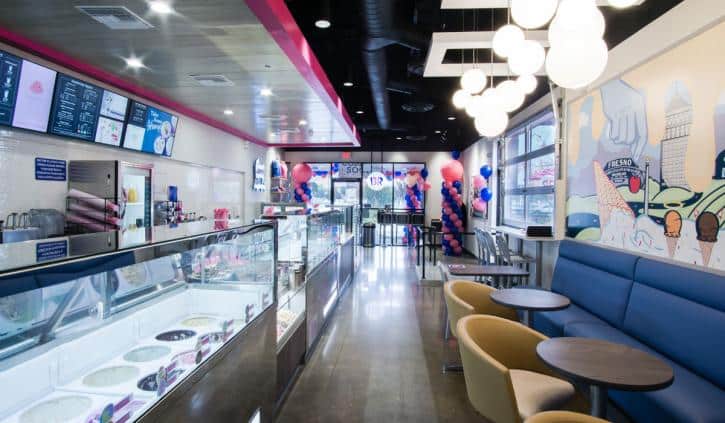
12. Baskin-Robbins
Total change in units from 2020: 102
2021 Total Units: 2,317
Franchised stores: 2,317
Company stores: 0
U.S. systemwide sales (millions): $686
Average sales per unit (thousands): $296
Click here for a free download of the entire QSR 50 and brand-by-brand breakdown.
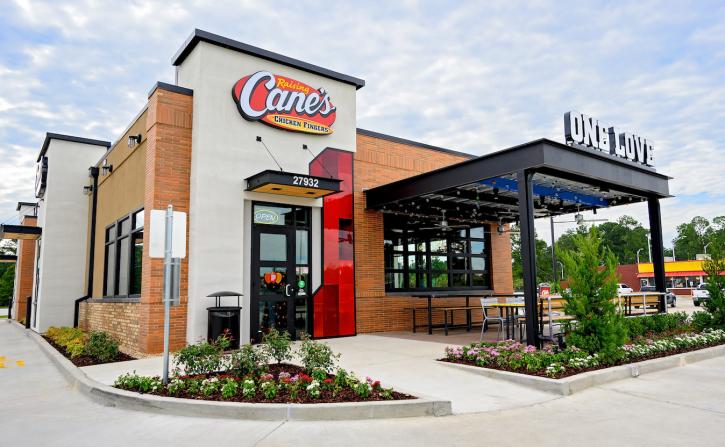
13. Raising Cane’s
Total change in units from 2020: 58
2021 Total Units: 567
Franchised stores: 23
Company stores: 544
U.S. systemwide sales (millions): $2,377
Average sales per unit (thousands): $4,893
Click here for a free download of the entire QSR 50 and brand-by-brand breakdown.
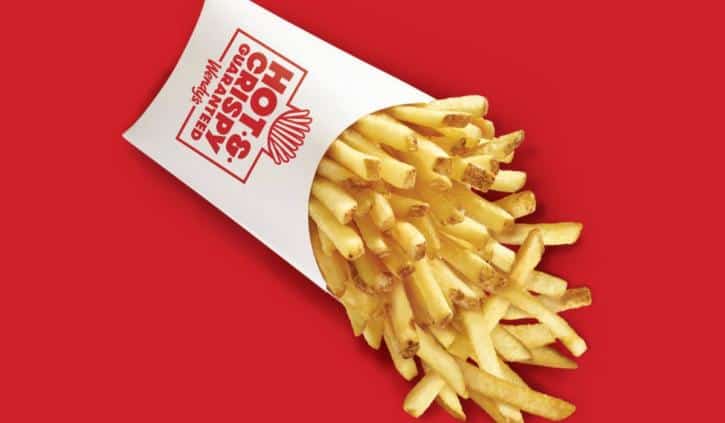
14. Wendy’s
Total change in units from 2020: 57
2021 Total Units: 5,938
Franchised stores: 5,535
Company stores: 403
U.S. systemwide sales (millions): $11,111
Average sales per unit (thousands): $1,895
Click here for a free download of the entire QSR 50 and brand-by-brand breakdown.
15. Culver’s
Total change in units from 2020: 55
2021 Total Units: 837
Franchised stores: 831
Company stores: 6
U.S. systemwide sales (millions): $2,489
Average sales per unit (thousands): $3,099
Click here for a free download of the entire QSR 50 and brand-by-brand breakdown.
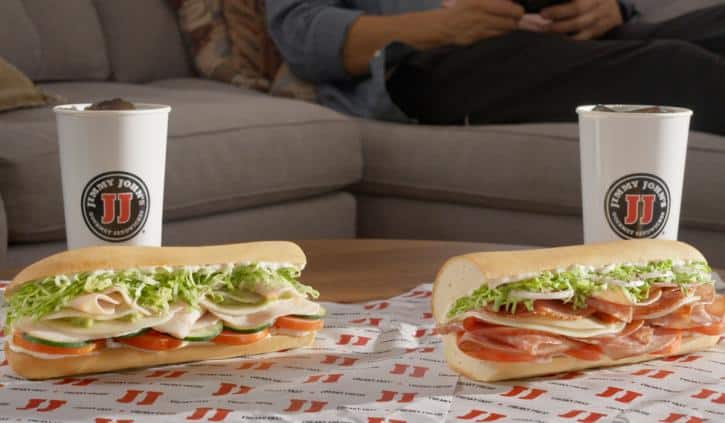
16. Jimmy John’s
Total change in units from 2020: 48
2021 Total Units: 2,657
Franchised stores: 2,616
Company stores: 41
U.S. systemwide sales (millions): $2,301
Average sales per unit (thousands): $866
Click here for a free download of the entire QSR 50 and brand-by-brand breakdown.
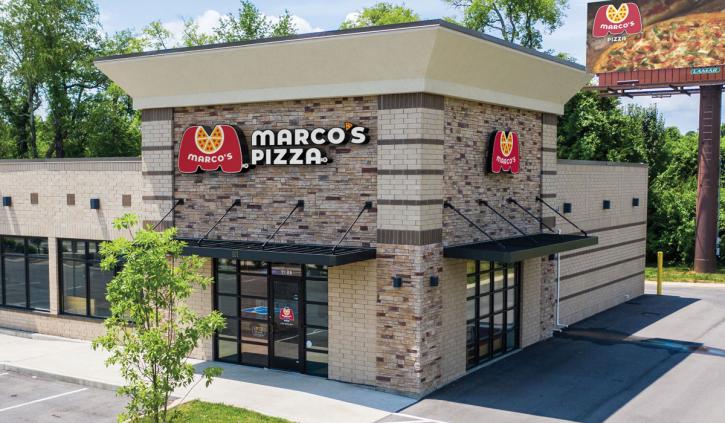
17. Marco’s Pizza
Total change in units from 2020: 48
2021 Total Units: 1,002
Franchised stores: 957
Company stores: 45
U.S. systemwide sales (millions): $899
Average sales per unit (thousands): $934
Click here for a free download of the entire QSR 50 and brand-by-brand breakdown.
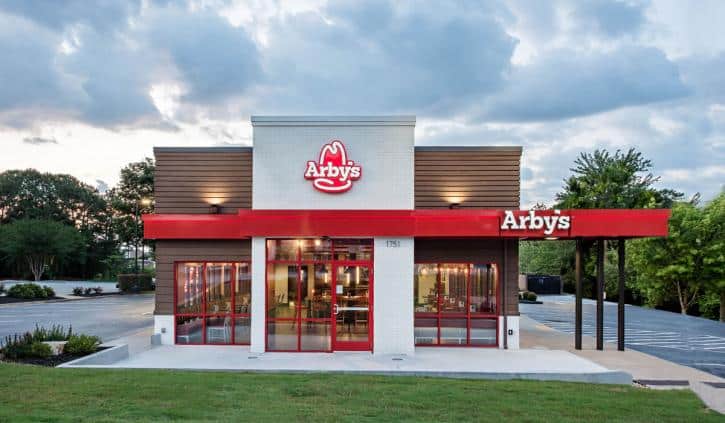
18. Arby’s
Total change in units from 2020: 40
2021 Total Units: 3,409
Franchised stores: 2,293
Company stores: 1,116
U.S. systemwide sales (millions): $4,462
Average sales per unit (thousands): $1,309
Click here for a free download of the entire QSR 50 and brand-by-brand breakdown.
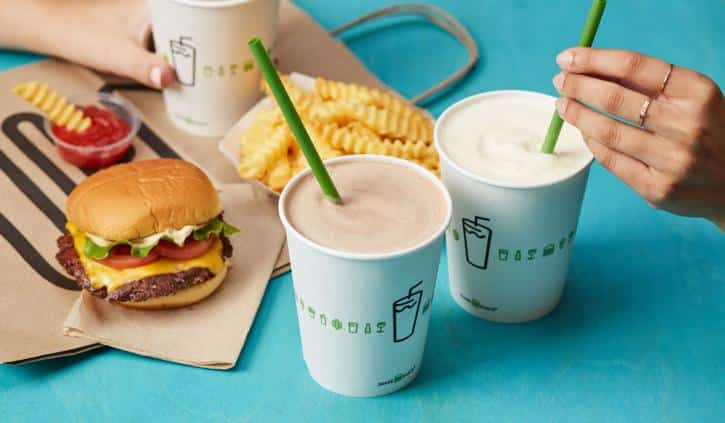
19. Shake Shack*
Total change in units from 2020: 38
2021 Total Units: 243
Franchised stores: 25
Company stores: 218
U.S. systemwide sales (millions): $777
Average sales per unit (thousands): $3,679
Click here for a free download of the entire QSR 50 and brand-by-brand breakdown.
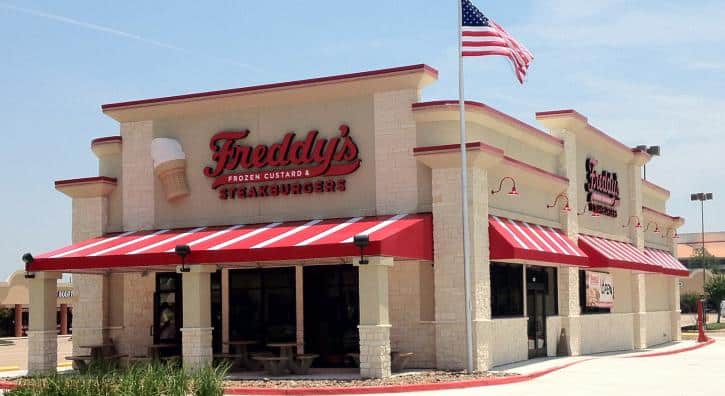
20. Freddy’s Frozen Custard & Steakburgers
Total change in units from 2020: 32
2021 Total Units: 420
Franchised stores: 391
Company stores: 29
U.S. systemwide sales (millions): $759
Average sales per unit (thousands): $1,842
Click here for a free download of the entire QSR 50 and brand-by-brand breakdown.
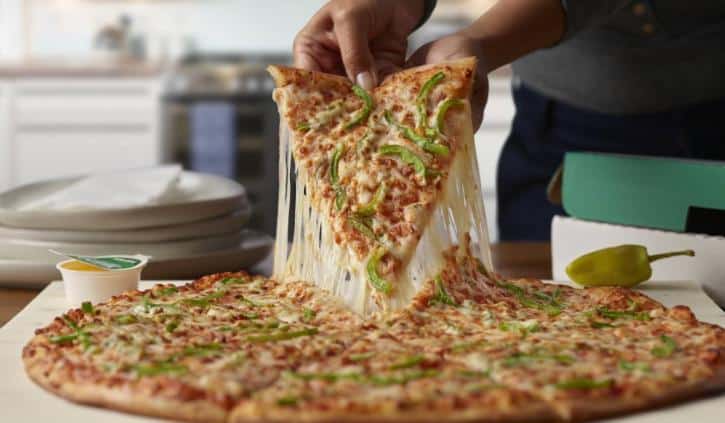
21. Papa Johns
Total change in units from 2020: 30
2021 Total Units: 3,164
Franchised stores: 2,564
Company stores: 600
U.S. systemwide sales (millions): $3,486
Average sales per unit (thousands): $1,147
Click here for a free download of the entire QSR 50 and brand-by-brand breakdown.
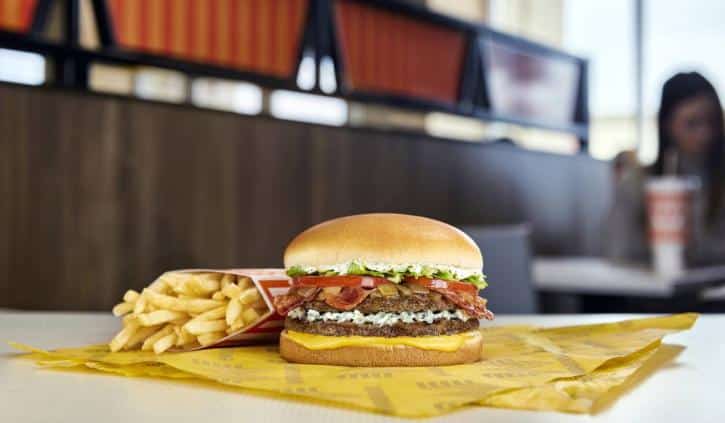
22. Whataburger
Total change in units from 2020: 29
2021 Total Units: 873
Franchised stores: 131
Company stores: 742
U.S. systemwide sales (millions): $3,089
Average sales per unit (thousands): $3,640
Click here for a free download of the entire QSR 50 and brand-by-brand breakdown.
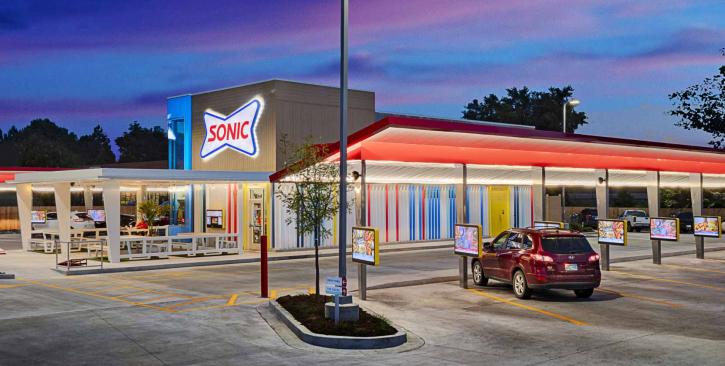
23. Sonic Drive-In
Total change in units from 2020: 26
2021 Total Units: 3,552
Franchised stores: 3,232
Company stores: 320
U.S. systemwide sales (millions): $5,835
Average sales per unit (thousands): $1,643
Click here for a free download of the entire QSR 50 and brand-by-brand breakdown.
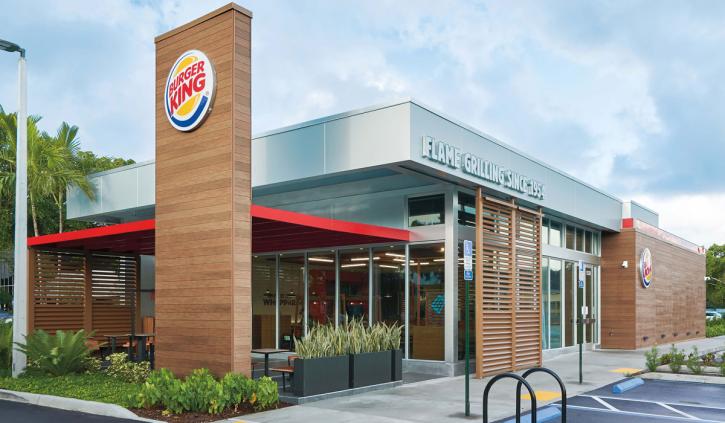
24. Burger King
Total change in units from 2020: 24
2021 Total Units: 7,105
Franchised stores: 7,054
Company stores: 51
U.S. systemwide sales (millions): $10,033
Average sales per unit (thousands): $1,470
Click here for a free download of the entire QSR 50 and brand-by-brand breakdown.
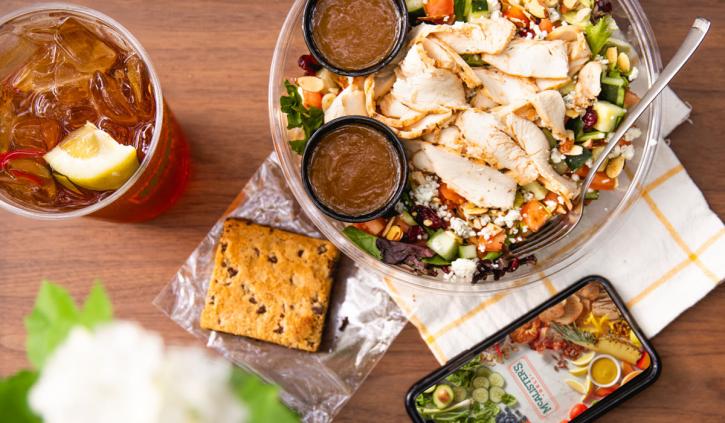
25. McAlister’s Deli
Total change in units from 2020: 24
2021 Total Units: 505
Franchised stores: 472
Company stores: 33
U.S. systemwide sales (millions): $869
Average sales per unit (thousands): $1,866
Click here for a free download of the entire QSR 50 and brand-by-brand breakdown.

