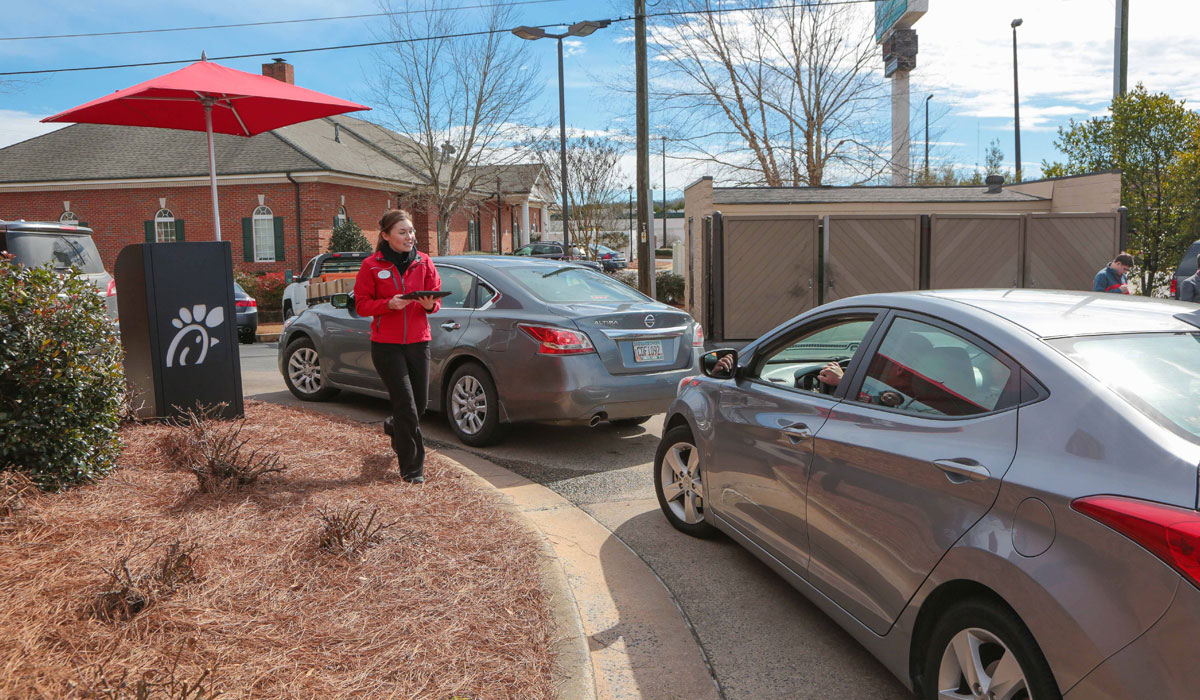
Chick-fil-A was one of the industry’s top performers ahead of the pandemic, a reality that only anchored deeper as drive-thrus became the lifeline of quick service. Chick-fil-A operators turned parking lots into transaction centers, lines into double and triple makeshifts, with the brand’s outside order-takers roaming through stacks wrapped around buildings.
In QSR’s 2022 Drive-Thru Report in tandem with Intouch Insights, Chick-fil-A lagged the field in average service time at 325.47 seconds. However, this wasn’t so much a signal of the brand’s clock slowing as much as it illustrated how busy Chick-fil-A truly was. The chain was given a 93 percent for speed of service satisfaction, per QSR’s Drive-Thru survey, which trailed only Arby’s (96 percent).
The reason owes to a double-sided point: When it came to the number of cars in line when mystery shoppers pulled up, Chick-fil-A began at the bottom—only 11 percent of the time there were no cars ahead—and rocketed into its own stratosphere at the five-car mark. There, shoppers saw five vehicles lined up nearly 11 percent of the time. The closest brand was McDonald’s and Burger King at 4 percent.
Even more telling was the 10-plus cars metric. There, Intouch Insight data discovered lines of that length and longer 16 percent of the time at Chick-fil-A. McDonald’s followed at 2 percent, while Arby’s and Wendy’s each notched 1 percent. Everybody else was at zero.
The average cars in line went as follows: Chick-fil-A, 5.45; McDonald’s, 3.13; Wendy’s, 2.67; Arby’s, 2.28; Burger King, 2.19; Taco Bell, 2.17; Dunkin’, 2.11; KFC, 1.8; Hardee’s, 1.64; and Carl’s Jr. 1.63.
And then there’s the customer perception note. Here’s average total time by cars in line. Simply, Chick-fil-A was moving people quicker than anybody else.
- 1. Chick-fil-A: 107.41 (seconds)
- 2. McDonald’s: 118
- 3. Taco Bell: 127.58
- 4. Arby’s: 139.92
- 5. Dunkin’: 140.21
- 6. Wendy’s: 141.67
- 7. Burger King: 147.43
- 8. KFC: 142.84
- 9. Hardee’s: 180.21
- 10. Carl’s Jr. 193.6
This combination of having a massive stretch of cars, yet getting them through faster than the pack, lays the base for why Chick-fil-A just turned in another popping sales run.
The brand, in its annual FDD, released Wednesday, revealed it generated $18.814 billion in U.S. systemwide sales last year. That figure was $16.674 billion, $13.7 billion, and $12.2 billion, in 2021, 2020, and 2019, respectively.
MORE: CHECK OUT LAST YEAR’S SALES UPDATE
As of December 31, 2022, 2021, 2020, and 2019, there were 2,429, 2,325, 2,219, and 2,117 franchised and company-operated Chick-fil-A restaurants, respectively.
Chick-fil-A’s total revenue and income in 2022 was $6,373,786,108. In 2021, it was $5,764,153,899 and $4,321,122,548 the year before.
Along this path, Chick-fil-A has posted steady growth. It expanded by a net of 100 stores in 2022, climbing from 2,311 franchised and company-run units to 2,411. In the past three years, the chain has added 100, 102, and 98 units, each calendar, respectively. Last year, Chick-fil-A trimmed its company-owned restaurant count by eight stores from 81 to 73, but grew its franchised footprint 108 venues from 2,230 to 2,338.
In total, as of December 31, 2022, there were 2,806 domestic Chick-fil-A Restaurants open and operating, including roughly 2,411 domestic company-operated and franchised operator Chick-fil-As and 395 domestic Chick-fil-A licensed units.
But as always, where Chick-fil-A emerges is at the store level. For freestanding and drive-thru locations (non-mall environments), of which about 1,925 locations counted and were opened at least a full calendar year, the median annual sales volume was $8.51 million and average annual sales volume $8.676 million, with 919 of the 1,925 locations, or 48 percent, hitting that mark or higher. One operator pulled in $16.985 million. Roughly 34 percent reported annual sales volumes less than $7.6 million. About 33 percent fell between $7.6 and $9.5 million. And, in maybe the most pulsing stat, 33 percent of operators in this freestanding field generated annual sales volumes north of $9.5 million.
In 2021, the figure was $8.142 million, which was nearly 15 percent higher than Chick-fil-A’s 2020 result of $7.096 million.
Mall stores, or units sans drive-thrus, in 2022 were closer to $2.7 million.
For licensed units located on college or university campuses that were open at least one year as of December 31, 2022, it was $926,127 and AUV was $1.107 million.
Chick-fil-As in hospitals, businesses, industries or airports generated AUVs of $2.481 million. This ranged as high as $10.065 million and as low as $72,747.
At the end of 2022, Chick-fil-A also operated 10 franchised locations outside of the U.S., seven of which are in Canada and three in Puerto Rico. The company noted in the FDD it “is actively exploring opportunities to continue franchised restaurant growth in Canada and Puerto Rico as well as opportunities to continue expansion into other international locations in the future.”
Chick-fil-A plans to invest $1 billion on an international growth push as it looks to open restaurants in Europe and Asia by 2025, with stores in five international markets come 2030.