Quick Links
| QSR 50 Profiles | Segments | |
| The Charts | Burger | Pizza/Pasta |
| Top 50 | Sandwich | Chicken |
| Top 50 by Units | Snack | Asian & Seafood |
| Video Report | Mexican |
Download Last Year’s QSR 50 in PDF Format
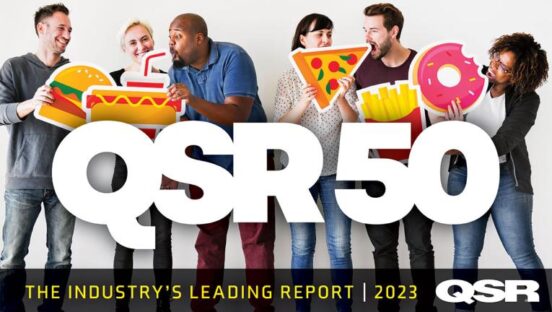
The much-anticipated annual QSR 50 ranking is here, and at the top of this year’s list is hamburger heavy weight McDonald’s with more than $32 billion in systemwide sales in the U.S. during fiscal 2010.
For in-depth analysis on all 50 brands on this year’s list, click the Profiles link in the yellow box above.
The main chart below allows you to customize the QSR 50 to your data-mining needs. Click the top of each column to sort. Then explore the industry by segments using the yellow navigation box above.
Click Column Header to Sort
| QSR 50 Rank | Company | Segment | Number of Franchised Units in 2010 | Number of Company Units in 2010 | Total Units in 2010 | Total Change in Units from 2009 |
| 14 | Arby’s | sandwich | 2,505 | 1,144 | 3,649 | -69 |
| 37 | Baskin Robbins* | snack | 2,600 | 0 | 2,600 | 55 |
| 31 | Bojangles’ | chicken | 298 | 186 | 484 | 27 |
| 41 | Boston Market* | chicken | 0 | 491 | 491 | -29 |
| 3 | Burger King*2 | burger | 6,380 | 873 | 7,253 | 3 |
| 47 | Captain D’s | seafood | 251 | 280 | 531 | -4 |
| 23 | Carl’s Jr.* | burger | 674 | 423 | 1,097 | 11 |
| 34 | Checkers/Rally’s | burger | 505 | 299 | 804 | -16 |
| 11 | Chick-fil-A | chicken | 1,461 | 76 | 1,537 | 57 |
| 18 | Chipotle | mexican | 0 | 1,084 | 1,084 | 129 |
| 26 | Church’s Chicken | chicken | 980 | 270 | 1,250 | 24 |
| 39 | CiCi’s Pizza* | pizza/pasta | 581 | 13 | 594 | -31 |
| 49 | Cold Stone Creamery | snack | 1,100 | 22 | 1,122 | 76 |
| 33 | Culver’s | burger | 415 | 9 | 424 | 11 |
| 16 | Dairy Queen* | burger | 4,452 | 62 | 4,514 | -25 |
| 36 | Del Taco | mexican | 234 | 288 | 522 | 6 |
| 12 | Domino’s Pizza* | pizza/pasta | 4,479 | 450 | 4,929 | 2 |
| 7 | Dunkin' Donuts* | snack | 6,746 | 26 | 6,772 | 206 |
| 48 | Einstein Bros. Bagels* | sandwich | 229 | 354 | 583 | 51 |
| 38 | El Pollo Loco | chicken | 241 | 171 | 412 | -3 |
| 30 | Five Guys Burgers & Fries | burger | 634 | 102 | 736 | 195 |
| 19 | Hardee’s* | burger | 1,226 | 466 | 1,692 | -64 |
| 45 | In-N-Out Burger* | burger | 0 | 252 | 252 | 13 |
| 15 | Jack in the Box | burger | 1,250 | 956 | 2,206 | -6 |
| 42 | Jason’s Deli | sandwich | 101 | 125 | 226 | 11 |
| 29 | Jimmy John’s* | sandwich | 1,107 | 24 | 1,131 | 162 |
| 9 | KFC | chicken | 4,275 | 780 | 5,055 | -107 |
| 50 | Krystal* | burger | 145 | 219 | 364 | -20 |
| 24 | Little Caesars* | pizza/pasta | 2,250 | 550 | 2,800 | 152 |
| 32 | Long John Silver’s* | seafood | 964 | 0 | 964 | -25 |
| 1 | McDonald’s | burger | 12,477 | 1,550 | 14,027 | 47 |
| 22 | Panda Express | asian | 28 | 1,308 | 1,336 | 62 |
| 13 | Panera Bread | sandwich | 791 | 662 | 1,453 | 73 |
| 35 | Papa Murphy’s | pizza/pasta | 1,222 | 33 | 1,255 | 84 |
| 17 | Papa John’s | pizza/pasta | 2,280 | 591 | 2871 | 90 |
| 8 | Pizza Hut | pizza/pasta | 7,083 | 459 | 7,542 | -24 |
| 20 | Popeyes* | chicken | 1,542 | 38 | 1,580 | 34 |
| 44 | Qdoba | mexican | 337 | 188 | 525 | 15 |
| 21 | Quiznos* | sandwich | 3,100 | 3 | 3,103 | -600 |
| 43 | Sbarro* | pizza/pasta | 302 | 476 | 778 | -7 |
| 10 | Sonic | burger | 3,117 | 455 | 3,572 | 28 |
| 5 | Starbucks* | snack | 4,424 | 6,707 | 11,131 | 0 |
| 27 | Steak N Shake* | burger | 75 | 412 | 487 | 2 |
| 2 | Subway* | sandwich | 23,850 | 0 | 23,850 | 816 |
| 6 | Taco Bell | mexican | 4,389 | 1,245 | 5,634 | 30 |
| 46 | Tim Hortons1 | snack | 598 | 4 | 602 | 39 |
| 4 | Wendy’s* | burger | 5,182 | 1,394 | 6,576 | 35 |
| 25 | Whataburger | burger | 172 | 545 | 717 | 15 |
| 40 | White Castle* | burger | 0 | 416 | 416 | -2 |
| 28 | Zaxby’s | chicken | 425 | 89 | 514 | 22 |
*Includes figures estimated by Technomic, Inc.
1. Systemwide sales from franchised units only
2. Total change in units calculated from data reported in 2010 QSR 50