
In its recent earnings recap, Texas Roadhouse provided some color behind what’s been a commonplace anecdote of late: January was a challenging dip for restaurants. It seemed to cross an intersection of bad weather, high pricing, and consumers tightening spend in the face of early year costs. CFO Chris Monroe told investors January had “two really tough weeks” that hit guests counts by about 2.5 percent.
The sit-down brand, which just posted record openings and is generating average-unit volumes north of $7 million, posted same-store sales gains of 6.8 percent across the opening 50 days of 2024, with stores averaging about $155,000 per week. “Our operators, they slogged through those two very difficult weeks and took care of the customers that were able to show up and serve them well,” Monroe said.
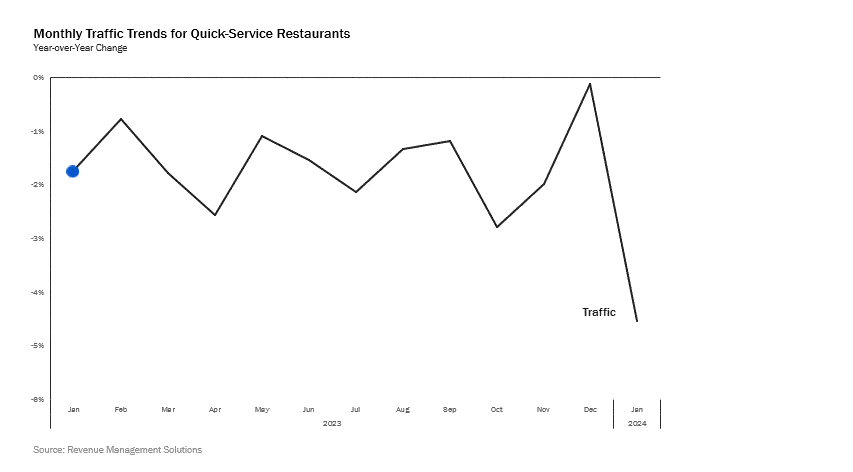
Revenue Management Solutions recently broke down the trends further, with quick service as the focus. The sector’s U.S. traffic declined 4.5 percent, year-over-year, negatively lapping a January 2023 that was also in the red at negative 1.7 percent. December 2023 was down just 0.1 percent as well.
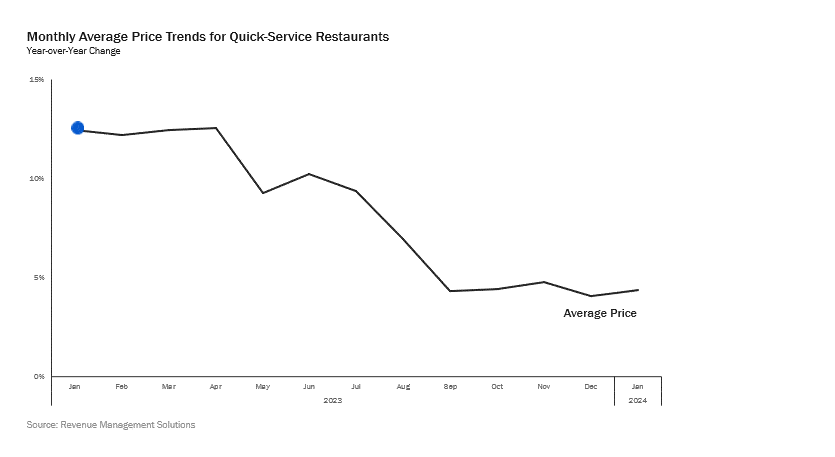
Meanwhile, average price increased 4.4 percent versus the year-ago period as the rate of price increases appears to have stabilized following nearly a year of declining jumps.
One thing that pulsed as well was net sales sliding (negative 0.3 percent) into sub territory for the first time in recent history, an indictor, RMS said, the slowdown of price increases may affect the bottom line for restaurant operators. According to the Bureau of Labor Statistics, average price is up 4.4 percent in the category.
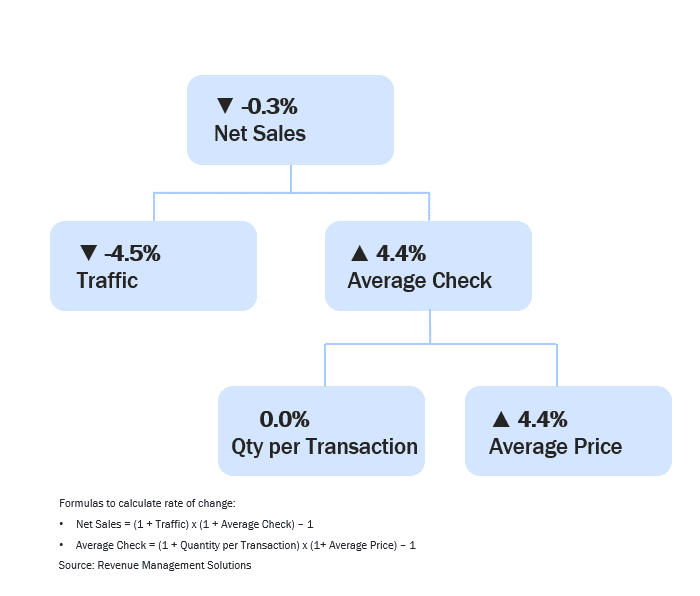
RMS data showed a 4.4 percent hike in average price with quantity per transaction remaining unchanged at flat year-over-year growth. To note, it was consistently negative in 2023, so the result isn’t exactly an upward development; but it’s also not a downward one.
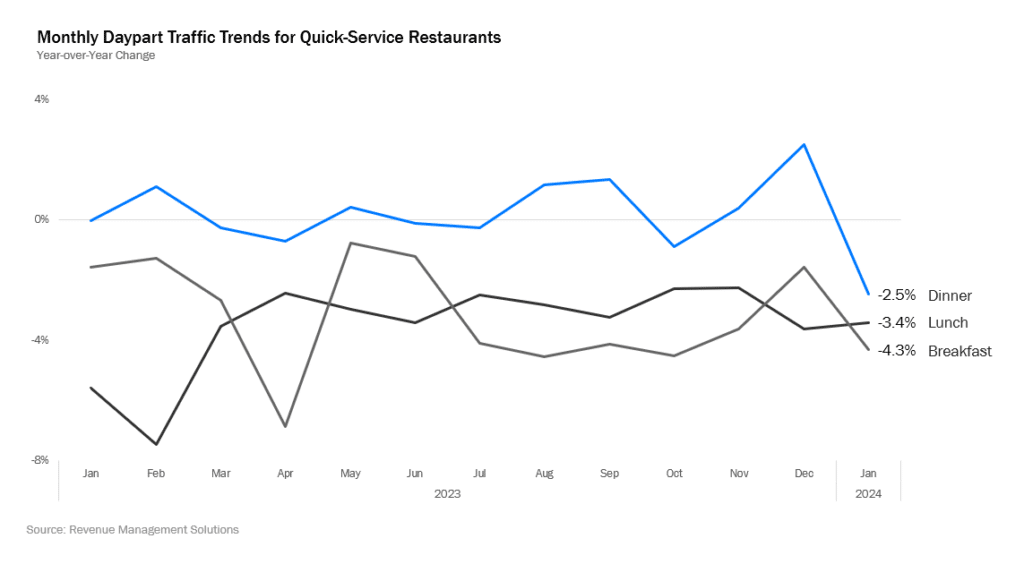
Dinner traffic decreased 2.5 percent versus January 2023 while lunch was down 3.4 percent, yet did see some month-over-month improvement. Breakfast traffic experienced a decrease of 4.3 percent.
The below chart is something RMS suggested could happen in Q4 as it asked consumers, going forward, how often they planned to frequent channels of restaurant trade. All were negative—drive-thru (negative 8 percent); dine-in (negative 15 percent); takeout (negative 15 percent); delivery (negative 25 percent).
More than two in three respondents in RMS’ survey said they felt they were paying higher restaurant prices.
It’s been a steady line.
Restaurant prices:
- Q4: 77 percent
- Q3: 77 percent
- Q2: 80 percent
- Q1: 81 percent
- Q4 2022: 82 percent
And for grocers:
- Q4: 70 percent
- Q3: 71 percent
- Q2: 72 percent
- Q1: 74 percent
- Q4 2022: 75 percent
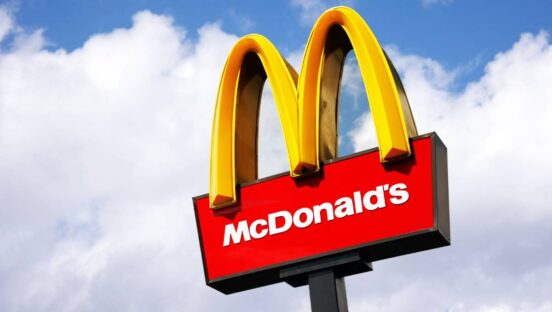
However, there is added emphasis recently on this topic. McDonald’s explored the notion in its Q4 call, with CEO Chris Kempczinski sharing the brand was ceding traffic at the $45,000 and under income level. “From an industry standpoint, we actually saw that cohort decrease in the most recent quarter, particularly I think as eating at home has become more affordable,” he said. “There’s been much less pricing that’s been taken more recently on packaged food. So you’re seeing that eating at home is becoming more affordable. That I think is putting some pressure from a IEO standpoint on that low-income consumer.”
Grocery and supermarket prices have declined for 16 straight months. The food-at-home (grocery store or supermarket food purchases) consumer price index decreased 0.1 percent from November to December and was 1.3 percent higher than December 2022.
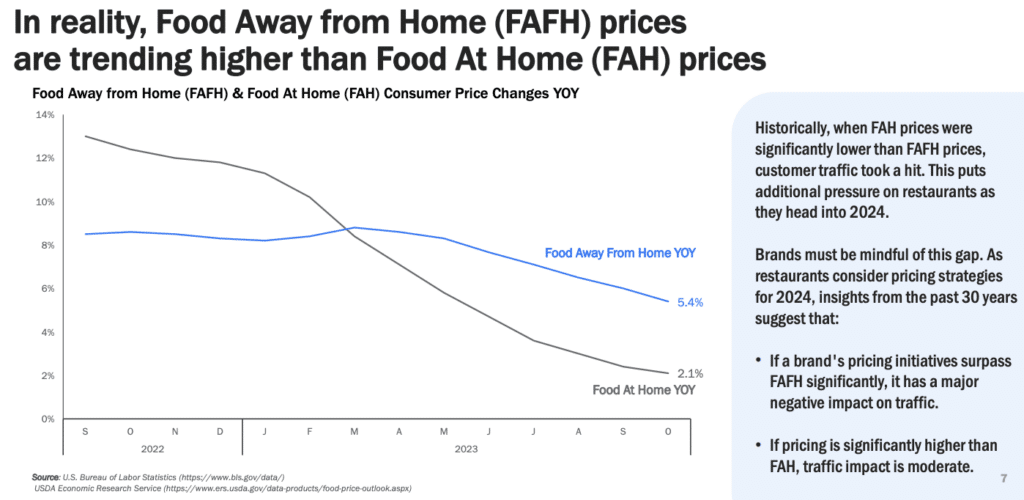
Food-away-from-home (restaurant purchases), lifted 0.3 percent in December 2023 and was 5.2 percent above December 2022.
More than one in three respondents in RMS’ Q4 survey reported spending less on restaurants. And about half of hose spending less said they were doing so by ordering less frequently.
How are you cutting back?
Order less frequently
- Q4: 48 percent
- Q3 2023: 52 percent
Choose less expensive restaurants
- Q4: 46 percent
- Q3 2023: 37 percent
Order less expensive items
- Q4: 46 percent
- Q3 2023: 34 percent
Purposely order fewer items to save
- Q4: 36 percent
- Q3 2023: 41 percent
Use more coupons and deals
- Q4: 31 percent
- Q3 2023: 23 percent
No longer order apps
- Q4: 25 percent
- Q3 2023: 12 percent
No longer order dessert
- Q4: 26 percent
- Q3 2023: 12 percent
Order more value-oriented options
- Q4: 23 percent
- Q3 2023: 19 percent
No longer order delivery to avoid fees
- Q4: 21 percent
- Q3 2023: 17 percent
No longer order beverage
- Q4: 16 percent
- Q3 2023: 13 percent
“When comparing to the previous quarter, it is evident that more customers are choosing to trade down to more budget-friendly restaurants and less expensive items on the menu,” RMS said.