


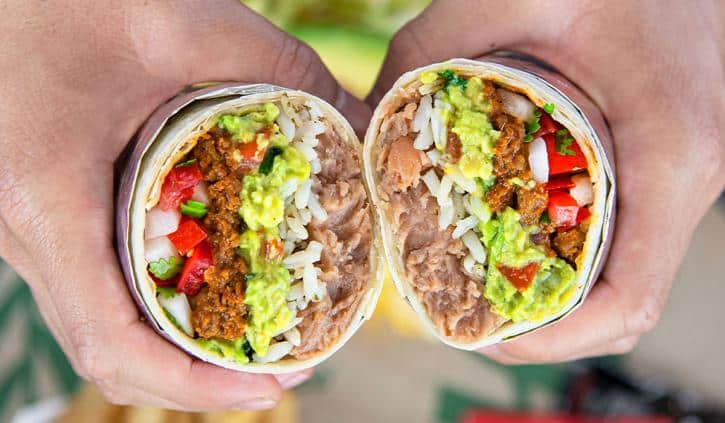
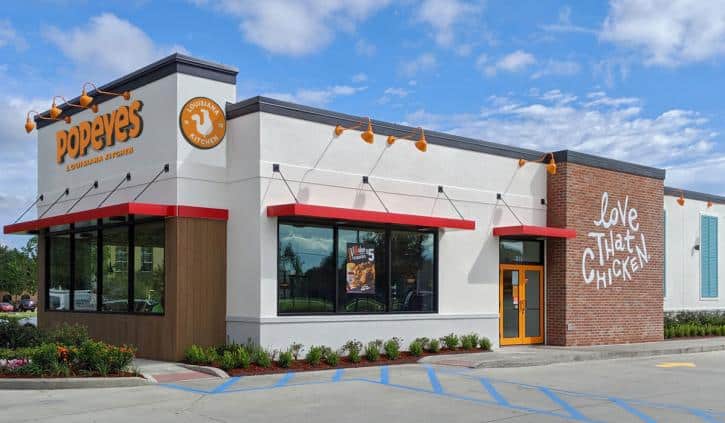
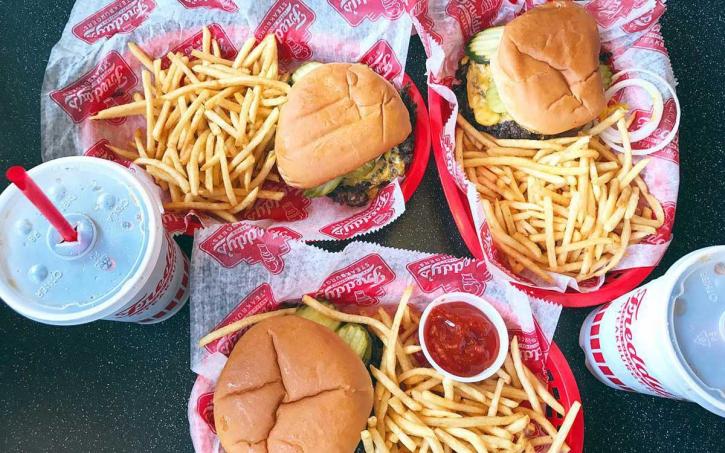
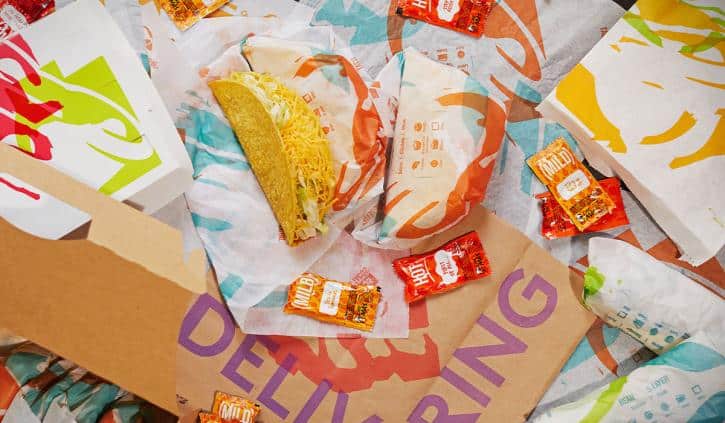
Each year, the QSR 50 gives an in-depth look at how the fast-food industry is performing.
One of those metrics, average-unit volume (AUV), gives insight from the store how restaurants are performing across their portfolios. Franchising brands often leverage AUV to give potential operators a sense of their return on investment.
Although COVID has significantly changed the landscape, this list of industry-best AUVs captures which companies were winning in the trenches prior to the crisis, and may indicate which are best positioned to thrive post-pandemic.
HERE ARE THE FULL-SERVICE RANKINGS
This year, we included the 15 brands just outside the top 50 as well. So this is a list of the top 29 AUVs among the 65 highest-grossing quick-service brands in America in terms of U.S. systemwide sales.
CHECK OUT PAST RESULTS OF THE QSR 50:
Note: The figures are by U.S. restaurants as of 2019 year end.
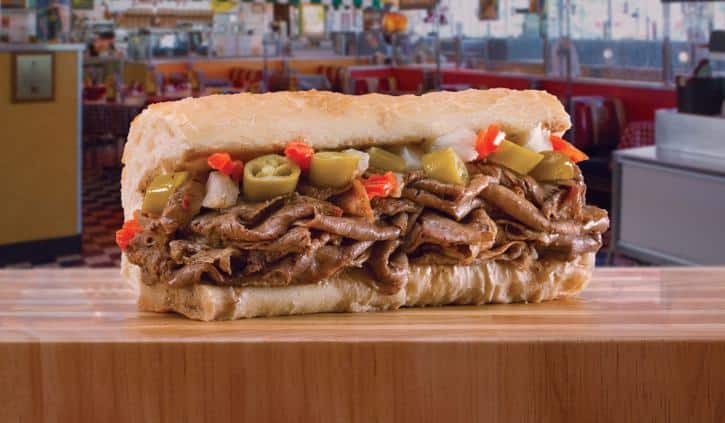
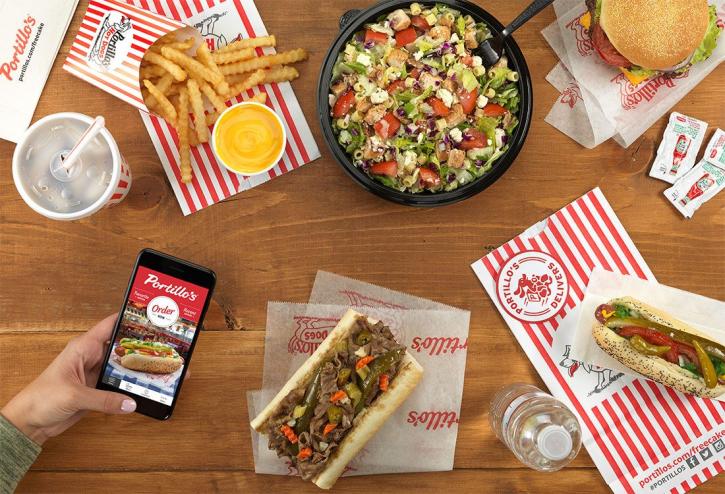
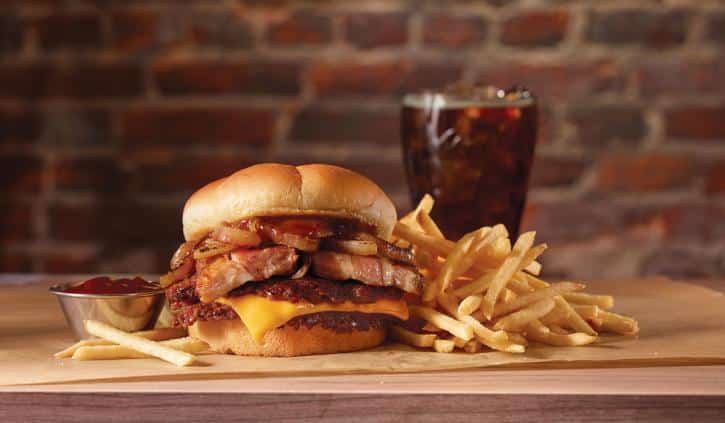
1. Portillo’s
Average sales per unit (thousands): $7,273
Unit count: 64
Franchised stores: 0
Company stores: 64
Total change in units from 2018: 7
U.S. systemwide sales (millions): $440
2. Chick-fil-A
Average sales per unit (thousands): $4,517
Unit count: 2,500
Franchised stores: 2,500
Company stores: 0
Total change in units from 2018: 130
U.S. systemwide sales (millions): $11,000
3. Shake Shack
Average sales per unit (thousands): $4,214
Unit count: 185
Franchised stores: 22
Company stores: 163
Total change in units from 2018: 59
U.S. systemwide sales (millions): $630
4. Raising Cane’s
Average sales per unit (thousands): $3,600
Unit count: 457
Franchised stores: 86
Company stores: 371
Total change in units from 2018: 57
U.S. systemwide sales (millions): $1,466
5. Whataburger
Average sales per unit (thousands): $3,080
Unit count: 830
Franchised stores: 703
Company stores: 127
Total change in units from 2018: 5
U.S. systemwide sales (millions): $2,556
6. McDonald’s
Average sales per unit (thousands): $2,912
Unit count: 13,846
Franchised stores: 13,154
Company stores: 692
Total change in units from 2018: –66
U.S. systemwide sales (millions): $40,413
7. In-N-Out Burger
Average sales per unit (thousands): $2,882
Unit count: 13,846
Franchised stores: 0
Company stores: 354
Total change in units from 2018: 14
U.S. systemwide sales (millions): $1,000
8. Panera Bread
Average sales per unit (thousands): $2,751
Unit count: 2,225
Franchised stores: 1,202
Company stores: 1,023
Total change in units from 2018: 132
U.S. systemwide sales (millions): $5,925
9. Jason’s Deli
Average sales per unit (thousands): $2,478
Unit count: 290
Franchised stores: 110
Company stores: 180
Total change in units from 2018: 11
U.S. systemwide sales (millions): $705
10. Culver’s
Average sales per unit (thousands): $2,435
Unit count: 733
Franchised stores: 727
Company stores: 6
Total change in units from 2018: 46
U.S. systemwide sales (millions): $1,730
11. Chipotle
Average sales per unit (thousands): $2,195
Unit count: 2,580
Franchised stores: 0
Company stores: 2,580
Total change in units from 2018: 130
U.S. systemwide sales (millions): $5,520
12. Zaxby’s
Average sales per unit (thousands): $2,030
Unit count: 904
Franchised stores: 755
Company stores: 149
Total change in units from 2018: 6
U.S. systemwide sales (millions): $1,840
13. The Habit Grill
Average sales per unit (thousands): $1,953
Unit count: 264
Franchised stores: 23
Company stores: 241
Total change in units from 2018: 21
U.S. systemwide sales (millions): $501
14. El Pollo Loco
Average sales per unit (thousands): $1,865
Unit count: 480
Franchised stores: 277
Company stores: 203
Total change in units from 2018: 4
U.S. systemwide sales (millions): $894
15. Panda Express
Average sales per unit (thousands): $1,765
Unit count: 2,184
Franchised stores: 138
Company stores: 2,046
Total change in units from 2018: 80
U.S. systemwide sales (millions): $3,800
16. Bojangles
Average sales per unit (thousands): $1,717
Unit count: 746
Franchised stores: 434
Company stores: 312
Total change in units from 2018: –10
U.S. systemwide sales (millions): $1,290
17. Steak ‘N Shake
Average sales per unit (thousands): $1,673
Unit count: 577
Franchised stores: 183
Company stores: 365
Total change in units from 2018: –19
U.S. systemwide sales (millions): $932
18. Wendy’s
Average sales per unit (thousands): $1,666
Unit count: 5,852
Franchised stores: 5,495
Company stores: 357
Total change in units from 2018: 30
U.S. systemwide sales (millions): $9,865
19. McAlister’s Deli
Average sales per unit (thousands): $1,629
Unit count: 469
Franchised stores: 438
Company stores: 31
Total change in units from 2018: 16
U.S. systemwide sales (millions): $719
20. Jack in the Box
Average sales per unit (thousands): $1,565
Unit count: 2,243
Franchised stores: 2,106
Company stores: 137
Total change in units from 2018: 6
U.S. systemwide sales (millions): $3,505
21. Del Taco
Average sales per unit (thousands): $1,554
Unit count: 596
Franchised stores: 296
Company stores: 300
Total change in units from 2018: 16
U.S. systemwide sales (millions): $850
22. Popeyes Louisiana Kitchen
Average sales per unit (thousands): $1,541
Unit count: 2,499
Franchised stores: 2,458
Company stores: 41
Total change in units from 2018: 131
U.S. systemwide sales (millions): $3,750
23. Freddy’s
Average sales per unit (thousands): $1,533
Unit count: 367
Franchised stores: 338
Company stores: 29
Total change in units from 2018: 39
U.S. systemwide sales (millions): $536
24. Taco Bell
Average sales per unit (thousands): $1,502
Unit count: 7,089
Franchised stores: 6,622
Company stores: 467
Total change in units from 2018: 181
U.S. systemwide sales (millions): $11,000
25. White Castle
Average sales per unit (thousands): $1,493
Unit count: 375
Franchised stores: 3
Company stores: 372
Total change in units from 2018: 0
U.S. systemwide sales (millions): $560
26. Starbucks
Average sales per unit (thousands): $1,454
Unit count: 15,041
Franchised stores: 6,768
Company stores: 8,273
Total change in units from 2018: 216
U.S. systemwide sales (millions): $21,550
27. Burger King
Average sales per unit (thousands): $1,399
Unit count: 7,346
Franchised stores: 7,294
Company stores: 52
Total change in units from 2018: 16
U.S. systemwide sales (millions): $10,300
28. Five Guys
Average sales per unit (thousands): $1,359
Unit count: 1,368
Franchised stores: 872
Company stores: 496
Total change in units from 2018: 10
U.S. systemwide sales (millions): $1,662
29. Sonic Drive-In
Average sales per unit (thousands): $1,320
Unit count: 3,526
Franchised stores: 3,329
Company stores: 197
Total change in units from 2018: –74
U.S. systemwide sales (millions): $4,687