
In Revenue Management Solutions’ latest data dive, quick-service traffic declined 1.7 percent, year-over-year, which has been a common tale of late (it was down 1.9 percent the prior month). The sales equation through this inflationary run has been growth on the top-line via price and multiple revenue channels, not transactions—average check was 5.5 percent higher last month, year-over-year, per RMS, thanks to average price jumping 9.6 percent. Overall, sales were positive at 3.7 percent over a year ago.
Unboxed, however, quantity per transaction fell 3.7 percent, which indicates diners ordered fewer items to guard their spend.
Trends by segment:
- Dine-in: Up 20 percent, year-over-year
- Delivery traffic: 14.6 percent higher
- Takeout: Plus 14.4 percent
- Drive-thru: Down 8.1 percent
Simon-Kucher recently conducted a survey about recessionary realities, inflation, and price increases across 50-plus brands, including 12 quick-service and eight fast-casual concepts (the rest were either pizza or full service).
Broadly, it found restaurants aren’t entirely sure what to expect from a macroeconomic view. When asked about a recession, 50 percent felt it was coming and would impact the foodservice sector. Forty-seven percent said they agreed it was en route, but it wouldn’t hurt restaurants. So, simply, the outlook is split.
While cost increases are slowing, surveyed chains said they still plan to increase costs in 2023 by nearly 9 percent. Interestingly, fast food was the only category that saw an increase in cost percentage this year compared to 2022, strongly driven by raw material costs (25 percent jump in 2022; raw materials make up roughly 34 percent of the category’s cost structure).
Restaurant cost increases over last year:
Fast food
- 2022 cost increase: 13 percent
- 2023 cost increase: 15 percent
Fast casual
- 2022 cost increase: 12 percent
- 2023 cost increase: 8 percent
Casual dining
- 2022 cost increase: 12 percent
- 2023 cost increase: 7 percent
Fine dining
- 2022 cost increase: 10 percent
- 2023 cost increase: 7 percent
Pizza
- 2022 cost increase: 11 percent
- 2023 cost increase: 7 percent
Costs are increasing, but the magnitude slid from 2022 to 2023.
And yet, restaurants said they’re planning for more frequent and aggressive price increases in 2023 to address market trends.
Price increase frequency per year
- Last 12 months: 1.4
- Next 12 months: 1.6
Price increase percentage magnitude per year
- Last 12 months: 4.6
- Next 12 months: 5.8
By category
Fast food
- Last 12 months: 4.8
- Next 12 months: 4.7 (the lone group in the red, year-over-year, at negative 2 percent, showing the value-focused field has reached a price wall of sorts)
Fast casual
- Last 12 months: 3.7
- Next 12 months: 4.9
Casual dining
- Last 12 months: 3.7
- Next 12 months: 5
Fine dining
- Last 12 months: 5.7
- Next 12 months: 7.9
Pizza
- Last 12 months: 4.9
- Next 12 months: 6.4
With this, consumer behavior is going to be a moving target with a value center.
How operators think customers are going to respond (scale 1–5):
- Look for more aggressive promos: 4.5
- The number of unique guests will decrease: 4.4
- Downgrade from premium items: 4.3
- Move to lower-priced competitors: 4.3
- Fewer new guests will come: 4.2
- Price increases will be tolerated less: 4.1
- Decrease frequency of purchases: 4
- Purchase fewer sides and drinks: 3.7
- Purchased fewer hero items: 3.4
And the response from restaurants (percentage of operators who plan to implement pricing and operations actions in the next year)
- Technology enhancements: 74 percent (up 7 percent from the last 12 months)
- Increase menu innovation: 72 percent (1 percentage points)
- Introduce or refine value meals: 57 percent (8 percentage points, a value war is on the horizon)
- Increased menu prices: 53 percent (–2 percentage points, suggesting the ceiling is approaching)
- Stimulate demand during new occasions: 52 percent (5 percentage points)
- Rationalize menu: 50 percent (7 percentage points)
- Introduce or refine group meals: 50 percent (–3 percentage points, a COVID staple slides back on the price front)
- Enter new channels: 48 percent (1 percentage points)
- Adjust current product composition: 48 percent (–9 percentage points, it appears loyalty programs are being deprioritized just as it becomes a key lever in reducing churn during an upcoming recession, Simon-Kucher said)
- Develop own delivery sales: 43 percent (–6 percentage points)
- Differentiate prices and promotions: 40 percent (–6 percentage points)
- De-bundle or remove discounts: 33 percent (–1 percentage points)
- Add restrictions or charge for condiments: 33 percent (–7 percentage points)
Customer satisfaction and the rankings, Chick-fil-A soars again
Through the industry’s COVID rebound, demand hasn’t been a barricade. The challenge has more been a seesaw of costs and guest satisfaction, and which channels to prioritize given the labor allocation it takes to execute any of them. The American Customer Satisfaction Index on Tuesday released its latest restaurant study from more than 16,000 consumers. It discovered customer satisfaction at full-service restaurants was up 1 percent to a score of 81 (scale to 100). That moved the industry back into the overall top spot, alongside athletic shoes and soft drinks. Quick service climbed 3 percentage points to 78.
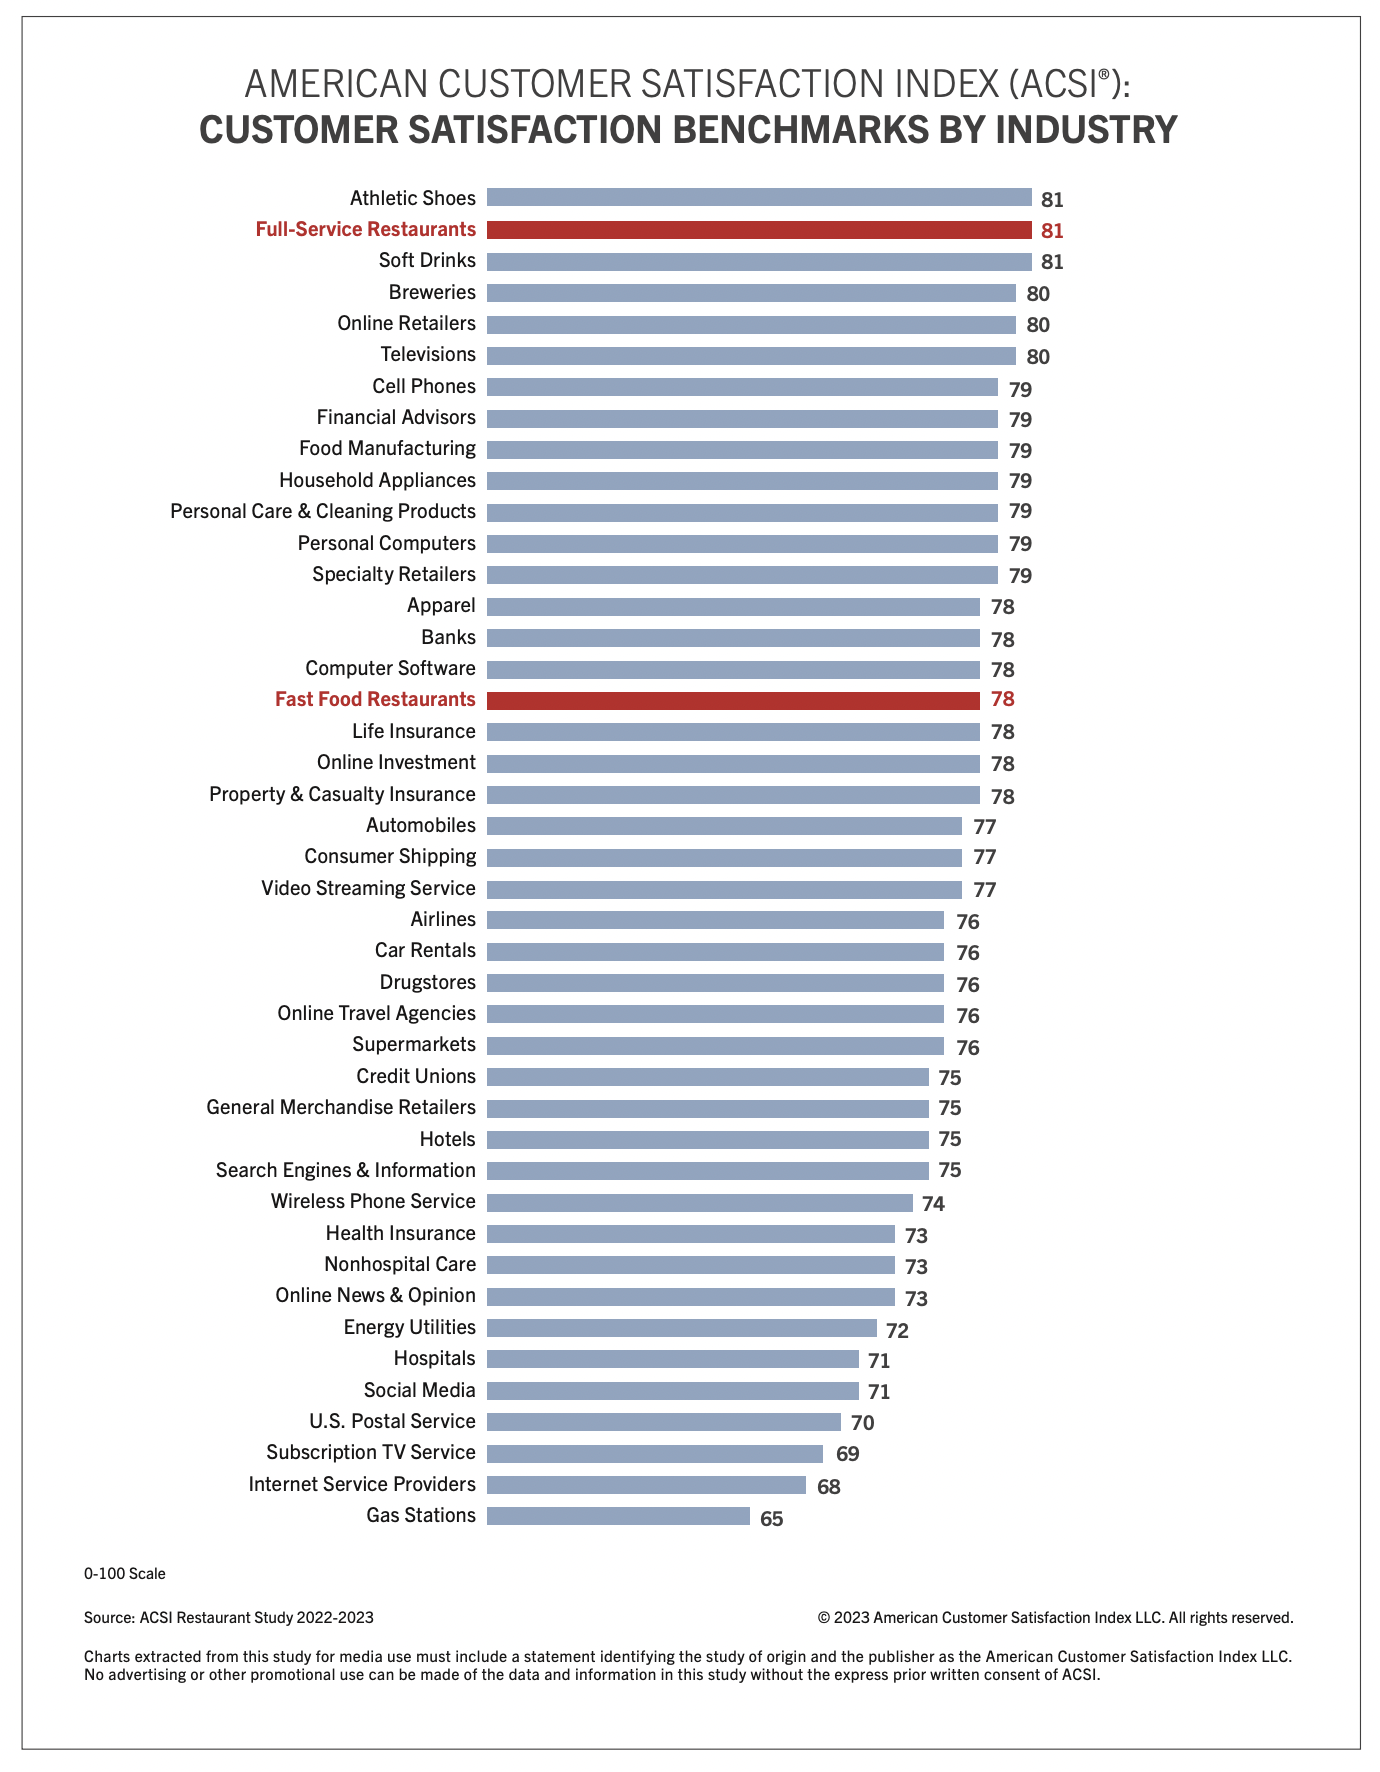
Forrest Morgeson, assistant professor of marketing at Michigan State University and director of research emeritus at the ACSI, noted full-service guest satisfaction returned to pre-COVID levels, while fast food is now within a point. “This good news is tempered, though, by increasing inflationary pressures, which are already slowing traffic,” he said in a statement. “Sooner rather than later, the industry is going to feel the pinch, and price competition and value will matter.”
Focusing on quick service, Chick-fil-A topped the rankings for the ninth straight year. It grew 2 percent to an ACSI score of 85.

The brand’s performance is far from anecdotal chatter. It generated $18.814 billion in U.S. sales across 2022, a figure that trailed only McDonald’s ($48.7 billion) and Starbucks ($28.1 billion). In 2019, the chain earned $12.2 billion and bumped to $13.7 billion and $16.67 billion in the ensuing years. Total revenue and income climbed from $4.32 billion to $6.37 billion. Average-unit volumes at freestanding drive-thrus ended 2022 at $8.676 million, up from $8.142 million and $7.096 million in 2021 and 2020, respectively.
COME HEAR CHICK-FIL-A CEO ANDREW CATHY KEYNOTE THE QSR EVOLUTION CONFERENCE
To spin it in differently, Chick-fil-A sold 527 million chicken sandwiches and served 2.1 billion guests last year as it opened 138 locations, selected 100 new operators, and entered two fresh markets—Puerto Rico and Hawaii.

Some competitors are gaining, however. Inspire Brands-run Jimmy John’s, which the Arby’s owner acquired in October 2019, took over sole passion of second place after rising 6 percentage points to 84. Jimmy John’s last year produced average-unit volumes of $900,000 on total domestic systemwide sales of $2.364 billion. It exited the calendar with 2,637 U.S. locations (2,597 franchised)—a year-over-year decrease of 26. While the footprint trimmed a bit, it came a calendar after Jimmy John’s expanded by net 48. And the AUV climbed from $866 to $900.
KFC also rose (4 points) in the list, as did Papa Johns (5).
On the full-service side, Outback took the top spot after surging 8 points to 83. ACSI credited the recent rollout of handheld ordering tablets and new ovens and grills (order accuracy, food quality, and food menu variety all rose).

Outback parent Bloomin’ Brands is in the process of remodeling more than 100 stores, including 50 Outbacks.
LongHorn and Texas Roadhouse each climbed 3 points to join Cracker Barrel (up 5) in second place at 82. ACSI cautioned the steakhouse race could face friction from potential record cattle prices. Market experts at CattleFax told beef producers at the 2023 Cattle Industry Convention in New Orleans that this could be a record price year for all classes of cattle. Economist Kevin Good said 50 percent of the nation’s cows were in a drought zone last year, leading to a 13.5 percent culling rate across the industry (the highest ever).
“With beef prices on the rise, these brands may face challenges in managing price increases and supply chain pressures,” Morgeson added in a statement. “On the other hand, the current inflationary environment is benefiting some of these brands as higher-income consumers opt for more affordable chain restaurants over pricier alternatives. This is definitely worth monitoring.”
Full service in general, as mentioned, had a strong showing. Nearly every brand measured saw an uptick in customer satisfaction. TGI Fridays (down 1) and IHOP (also down 1) were the only chains to slip.

Returning to value, despite hikes across the industry, perceived value improved year-over-year. Within full-service restaurants it was up 3 percent overall, while quality gained 4 percent. At Olive Garden, which has made it a point to keep menu price increases below the inflation rate, perceived value and quality with the restaurant each improved 5 percent as it crept closer to the industry averages in both metrics.
Applebee’s, which raised menu prices, gained 7 percent in quality and 5 percent in value. The company’s value-based promotions and all-you-can-eat deals are particularly attractive to clientele who are “trading down” due to inflation but still looking for full-service experiences, ACSI said.