What are some restaurant buzzwords we can’t escape? Delivery. Mobile. Integration. Ghost kitchens. Maybe some combination of all those things, with plant-based meat tossed into the fold. Yet are restaurant marketers skipping something dine-in and drive-thru guests literally can’t ignore? Research shows 56 percent of customers are influenced by menuboards, and 74 percent said an easy-to-read setup is a top priority.
Operators talk to length about streamlining the ordering process. And one of the quickest routes to a positive ROI might just be where diners do the vast majority of their purchasing.
At 77-unit B.GOOD, led by former Dunkin’ vet Chris Fuqua, who took over as CEO last June, the brand said it improved sales and made service leaders more effective by simplifying the look and feel of menuboards. Fuqua added the change propelled B.GOOD’s line and speed of service.
The big flip, though, came with guest-facing metrics. Consumers simply had too many options before. Pick a burger. What bun, cheese, protein would you like? The back and forth started to frustrate customers and employees alike. Now, B.GOOD offers top-to-bottom curated offers that can still be customized, but simply make a better first impression. Additionally, it allows the chain to nudge new users where it wants them to go.
Taco Bell decided in September it was going to cut combos in half, like “decluttering a closet,” the company said. It removed some items and updated displays to feature best-sellers and refreshed choices. Taco Bell’s setup was nearly 20 combos long before. Today’s version spotlights iconic, branded items, like the Cheesy Gordita Crunch and Crunchwrap supreme.
In both cases, menuboard optimization provided a chance to simplify without focusing solely on what was being cut. In fact, Taco Bell said the change made room for future menu innovation. It didn’t limit it. Improving speed of service wasn’t a bad kicker, either.
Yum! Brands COO David Gibbs said last quarter Taco Bell produced its best period in term of speed of service in five years. It boosted drive-thru times 17 seconds. Sounds small, but it led to some three million more cars rolling through.
B.GOOD echoed some of Taco Bell’s sentiments, noting how more straightforward menuboards provided innovation opportunities instead of constricting them, as abundant and slow-moving SKUs might.
Noodles & Company rolled out a broad refresh, too, this past year intended to bring attention to expansive changes, like Zoodles. Potbelly recently brought its center panel from 55 price points to 18 and introduced two new sections—make a meal and pick your pair. In Q3, menu optimization helped hike average check 5.8 percent, the company said.
Consultant company King-Casey and SeeLevel HX combined on a survey that takes a deep dive into the menuboard discussion.
The findings did not look into the use of digital menuboards, as only 30 percent of the brands in the study deployed them inside their four walls. None of them had digital displays at the drive thru.
The company dispatched 89 mystery shoppers to 152 different restaurant locations across six geographically dispersed states. The locations included (on average) 15 spots for each of 10 chains. Half were quick-serves: Arby’s, Burger King, Chick-fil-A, Dunkin’, and Taco Bell. The rest were fast casuals: Fazoli’s, Panda Express, Panera Bread, Raising Cane’s, and Starbucks.
At each venue, the mystery shopper made a statistical evaluation of both the drive thru and interior menuboards and then took photos of each. This took place in the spring of 2019.
Satisfaction, but room to grow
Two-thirds of the evaluators (66 percent) reported positive opinions of ordering from the menuboards, with 41 percent expressing top-box (liked it a lot) results. Drive thru and interior menuboards measured about the same. However, when asked what stood out, the shopper ratings varied significantly.

What does this mean? It’s really pretty straightforward: restaurant brands should invest in easier-to-read menuboards. Also, without changing menu items or pricing, brands would be well served to improve perceptions of food quality, which, in turn, could lift perceptions of value.
Interior menuboards collected higher overall “excellent” ratings (27 percent) than drive thrus (20 percent) and also polled higher in “encouraging bigger orders” at 55 to 47 percent.
If you consider many quick-serves see upward of 70 percent of business at the drive thru, the data suggests a new point of emphasis. There’s room to grow at the very least.
Viewing the lower end of the scale, more interior menuboards (15 percent) did not have “enough information” compared to drive-thru menuboards (5 percent).
One thing about the “encouraging bigger orders” note: It’s worth thinking how order-ahead functionality could play a role in closing this drive-thru gap. Few things in this universe are worse than pulling up behind a car that orders 40 hamburgers. You sit for 10 minutes as they’re tacking pickles off seven off them, adding mustard to another 13, etc, and the nightmare continues. Many chains have fixes in place like, “pull your car up or to the side and we’ll bring the food when it’s ready.” But those are Band-Aid realities that don’t satisfy every customer, especially younger ones who don’t major in attention spans. And these practices definitely don’t work for every employee.
In a convenience-crazed landscape, offering customers the ability to order ahead and simply roll up and grab their food, is a powerful tool to wield for quick-serves. It not only accelerates the process for guests—it gives operators a heads up and allows workers to stay ahead before they get bottled up and buried in orders, all while the clock is ticking. While it’s unrealistic to think every consumer will use order-ahead functionality (that 40-burger ordeal will always exist) it can’t hurt to have the option available. Especially since your competitors will surely get it soon.
Quick-serves and fast casuals: head to head
Some intriguing differences popped between the segments.

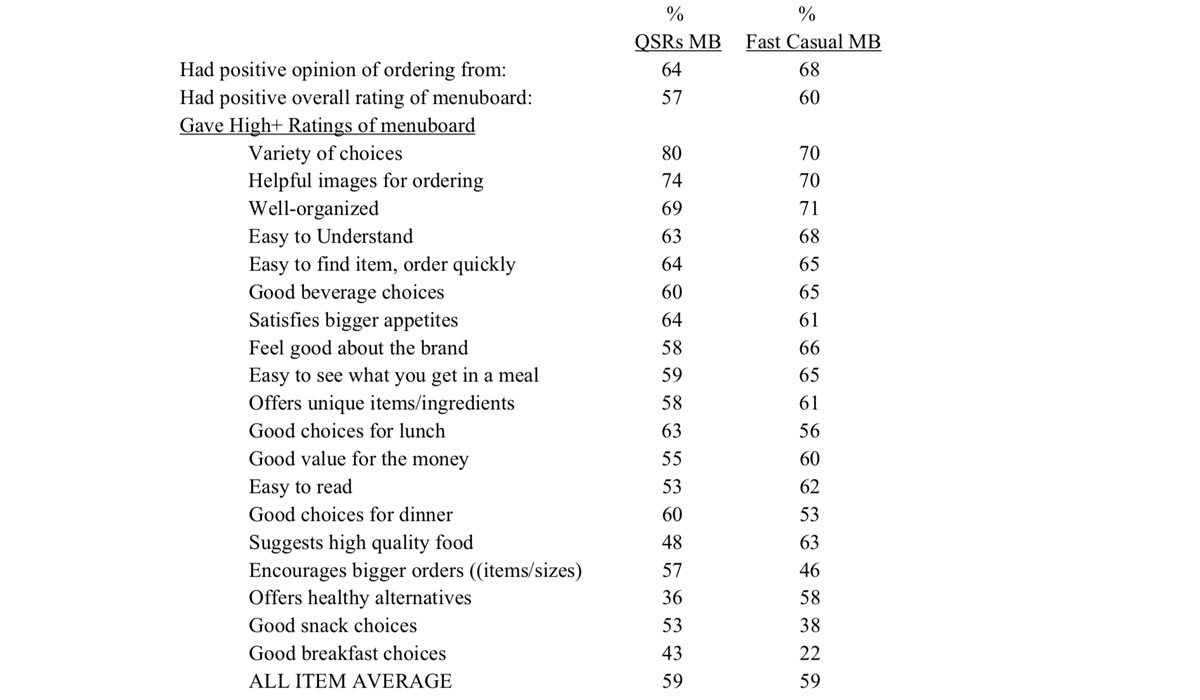
The findings: Quick-service menuboards were the clear winners in “showing variety of choices,” (80 versus 70 percent); “good choices for lunch” (63 versus 56 percent); and “for dinner” (60 versus 53 percent).
They also came ahead in “good choices for snacks” (53 versus 38 percent) and “for breakfast” (43 versus 22 percent). Those last two points aren’t surprisingly given fast casual’s tendency to skirt those occasions.
Overall, though, it appears quick-service brands, which, naturally, have a much deeper history with the drive thru, do a better a job communicating dayparts at the point of purchase. Fast casuals scored substantiality higher in “easy to understand” (68 versus 63 percent); making you “feel good about the brand’ (66 versus 58 percent); “easy to read” (62 versus 53 percent); “offering good value” (60 versus 55 percent); “high-quality food” (63 versus 48 percent); and “healthy alternatives” (58 versus 36 percent).
All of those are on part with the segment’s differentiators in general. Things like “easy to read” and “easy to understand,” though, might just be a result of fast casuals simply featuring newer assets. Less reworking and revamping and more starting from scratch.
By brand
Here’s how the restaurants studied stacked up.

The question that pops here, of course, is why is Starbucks at the bottom? What’s always worth considering is where the core equities lie. Is the Starbucks drive thru the fastest experience in the world? Is the customer in front of you trying to add 12 different ingredients to their drink?
Starbucks thrives because its guests are particular and know they can have that direct person-to-person interaction and achieve an end result they’re comfortable with. Personalization, complete with your name on the cup.
The point being that a streamlined and simplified ordering process might not be up Starbucks’ alley, so to speak. Not on the level of a Taco Bell. What Starbucks does well—habitual dining and social experiences—is a very individualized experience. And that’s not so easy to replicate or direct customers through with predetermined choices. It’s why their rewards program has 17.6 million members in it.
All that said, Panda Express and Fazoli’s are clearly doing a great job with the ordering process and leading customers through that purchasing journey.
Let’s look at some other findings
Below is a graph on the number of menu items listed. Remember, this is from the spring.

Panera’s 108 interior menuboard figure (113 at the drive thru) stands out. You could probably correlate this to why their scores in the previous chart lagged some other brands. But, at the same time, variety is kind of Panera’s MO. Could the chain benefit from some curation and displays that suggest items well suited for off-premises, like its new grain bowls?
Fazoli’s, with 69 interior item listings (71 drive thru) had the second-highest number. Burger King (66 and 58) and Taco bell (58 and 61) followed.
At the other end of the spectrum, Raising Cane’s limited menu led to 12 on both sides, followed by Panda Express (32 and 31), Starbucks (36 and 55), and Dunkin’ (40 and 36). Dunkin’ has been working on reducing its SKUs for a while now. It cut back 10 percent of its options looking to improve consistency and speed of service last year.

The above graph zeroes on menu images over menu items. Panda Express was lowest at three interior and 12 drive thru. Raising Cane’s (seven and nine), Arby’s (14 and 20), and Starbucks (12 and 23) were close behind. Panera displayed four images on the interior menuboard compared with 72 on the drive-thru version.
To put these numbers into perspective, the trimmed mean average number of menu items listed was 47 interior and 51 drive thru, while the trimmed mean average number of menu images displayed was 12 interior and 24 drive thru.
Some other visual assessment highlights:
- 70 percent of the menuboards had white backgrounds, resulting in a lack of brand differentiation
- 70 percent of the brands offered a kid’s meal
- 50 percent of the brands offering carbonated soft drinks did not show images of fountain beverages.
- 70 percent of the brands used “hot spots” to leverage core items.
- 60 percent of the brands offering combos had 14 or more combos
- While 8–10 is the optimum number of combos to offer (customers tune out after more), only Chick-fil-A fell in that range with eight offers on both interior and drive-thru menuboards. On the other hand, Arby’s (17 and 17), Burger King (14 and 14), and Taco Bell (12 and 15) had more. All other brands offered less than 8-10 combos
- 30 percent of the brands used interior digital menuboards. No brands deployed digital drive-thru menuboards. This was somewhat surprising, considering the amount of publicity this technology has received recently.
Where to start?
King-Casey provided 10 menuboard best practices from its experiences in the industry, as well as the survey results.
- 1. Conduct Attitude & Usage research to determine how customers perceive and use your menu.
- 2. Undertake a TURF analysis to assess which combination of products, services and pricing will allow you to appeal to the greatest number of customers
- 3. Develop a Menu Strategy that prioritizes menu items based on their contribution to your business objectives

- 4. Give prominence to your most profitable products in the “hot spots” of the menuboard—the places where customers tend to look first

- 5. Conduct a Space to Sales Analysis to determine the amount and prominence of space given to specific menu categories and items

- 6. Rank current and new products by sales, margin and operational complexity

- 7. Clarity is king! Too much information can be a negative.
- 8. Limit combos offerings to no more than 8–10
- 9. Use quantitative research to virtually test alternative menuboard strategies to determine the best strategy. Then test the “winning” strategy in actual stores.
- 10. Use “staged messaging” to support the menuboard and influence desirable sales


