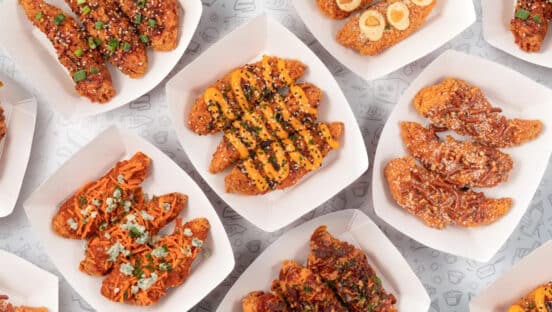
Perhaps due to a frantic news cycle, around restaurants and across the country in general, it appears we’ve reached a lull in the chicken sandwich wars. But don’t expect that to last.
The reason brands jumped into the fray in the fall and winter of 2019 and over the duration of 2020, isn’t complicated. Ever since Popeyes’ August 2019 launch, quick-serves fixated on replicating its viral success.
READ MORE: Who’s Really Winning the Chicken Sandwich Wars?
Data platform Sense360, measuring spend per panelist (year-over-year relative change), offered some meat behind the why.
Popeyes
- Launch: New chicken sandwich
- Week introduced: August 12, 2019
- Six weeks pre-launch (year-over-year relative percentage change): 8 percent
- Weeks following launch (first four weeks): 40 percent
- Net ppt change: +32
Wendy’s
- Launch: Spicy nuggets return
- Week introduced: August 19, 2019
- Six weeks pre-launch (year-over-year relative percentage change): Flat
- Weeks following launch (first two weeks): 5 percent
- Net ppt change: +5
McDonald’s
- Launch: New breakfast chicken biscuit and McGriddle
- Week introduced: January 27, 2020
- Six weeks pre-launch (year-over-year relative percentage change): 6 percent
- Weeks following launch (first four weeks): 6 percent
- Net ppt change: Flat
Burger King
- Launch: Spicy nuggets return
- Week introduced: May 11, 2020
- Two weeks pre-launch, due to COVID fluctuations (year-over-year relative percentage change): –6
- Weeks following launch (first four weeks): –1 percent
- Net ppt change: +5
Checkers/Rally’s
- Launch: New Mother Crunch sandwiches
- Week introduced: June 1, 2020
- Two weeks pre-launch, due to COVID fluctuations (year-over-year relative percentage change): 22
- Weeks following launch (first four weeks): 15 percent
- Net ppt change: –5
Del Taco
- Launch: New crispy chicken tacos
- Week introduced: August 17, 2020
- Six weeks pre-launch (year-over-year relative percentage change): 5
- Weeks following launch (first four weeks): 10 percent
- Net ppt change: +4
McDonald’s (partially coincided with Travis Scott promo in this case)
- Launch: New spicy chicken nuggets
- Week introduced: September 14, 2020
- Six weeks pre-launch (year-over-year relative percentage change): 18
- Weeks following launch (first four weeks): 22 percent
- Net ppt change: +4
Bojangles
- Launch: New pulled pork sandwich (a non-chicken entry)
- Week introduced: September 28, 2020
- Six weeks pre-launch (year-over-year relative percentage change): 24
- Weeks following launch (first four weeks): 28 percent
- Net ppt change: +4
Whataburger
- Launch: New spicy chicken sandwich
- Week introduced: September 28, 2020
- Six weeks pre-launch (year-over-year relative percentage change): 31
- Weeks following launch (first four weeks): 35 percent
- Net ppt change: +5
Arby’s
- Launch: Return of the Chicken Cheddar Ranch Sandwich
- Week introduced: October 5, 2020
- Six weeks pre-launch (year-over-year relative percentage change): 29
- Weeks following launch (first four weeks): 24 percent
- Net ppt change: –4
Wendy’s
- Launch: Revamped classic chicken sandwich
- Week introduced: October 19, 2020
- Six weeks pre-launch (year-over-year relative percentage change): 21
- Weeks following launch (first two weeks): 21 percent
- Net ppt change: Flat
Zaxby’s
- Launch: New Signature Sandwich
- Week introduced: October 26, 2020
- Six weeks pre-launch (year-over-year relative percentage change): 9
- Weeks following launch (first week, select markets): 11 percent
- Net ppt change: +3
Church’s Chicken
- Launch: New chicken sandwich
- Week introduced: October 26, 2020
- Six weeks pre-launch (year-over-year relative percentage change): 8
- Weeks following launch (first week): 12 percent
- Net ppt change: +4
So while some great results, replicating Popeyes’ trigger event is a unicorn target. Understandably so. As much as the brand has, impressively, continued heightened results—to the tune of $400,000 more per restaurant—even it understands this was going to dim as the category crowded.
Yet that doesn’t mean there isn’t plenty of runway to chase.
This graph below explains the base point.
![]()
Of the limited-service chains tracked by Sense360, four out of the top 10 fastest-growing (in terms of year-over-year panel spend) are chicken focused.
Some chicken brands:
February 2021
- Chick-fil-A: 17.42 percent
- Slim Chickens: 50.79 percent
- Raising Cane’s: 27.42 percent
- Wingstop: 25.74 percent
- Bojangles: 23.34 percent
- Church’s: 10.44 percent
- Zaxby’s: 9.96 percent
- KFC: 7.37 percent
The Top 10 (based on year-over-year spend growth)
- 1. Dutch Brothers Coffee: 89.43 percent
- 2. Slim Chickens: 50.79 percent
- 3. Braum’s Ice Cream and Dairy: 49.66 percent
- 4. Jersey Mike’s: 40.94 percent
- 5. Marco’s Pizza: 35.03 percent
- 6. Raising Cane’s: 27.42 percent
- 7. Wingstop: 25.74 percent
- 8. Sonic Drive-In: 25.13 percent
- 9. Togo’s: 23.97 percent
- 10. Bojangles: 23.14 percent
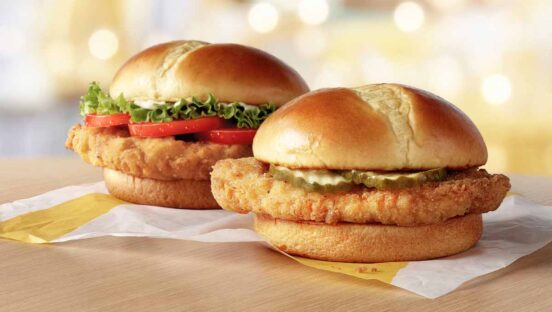
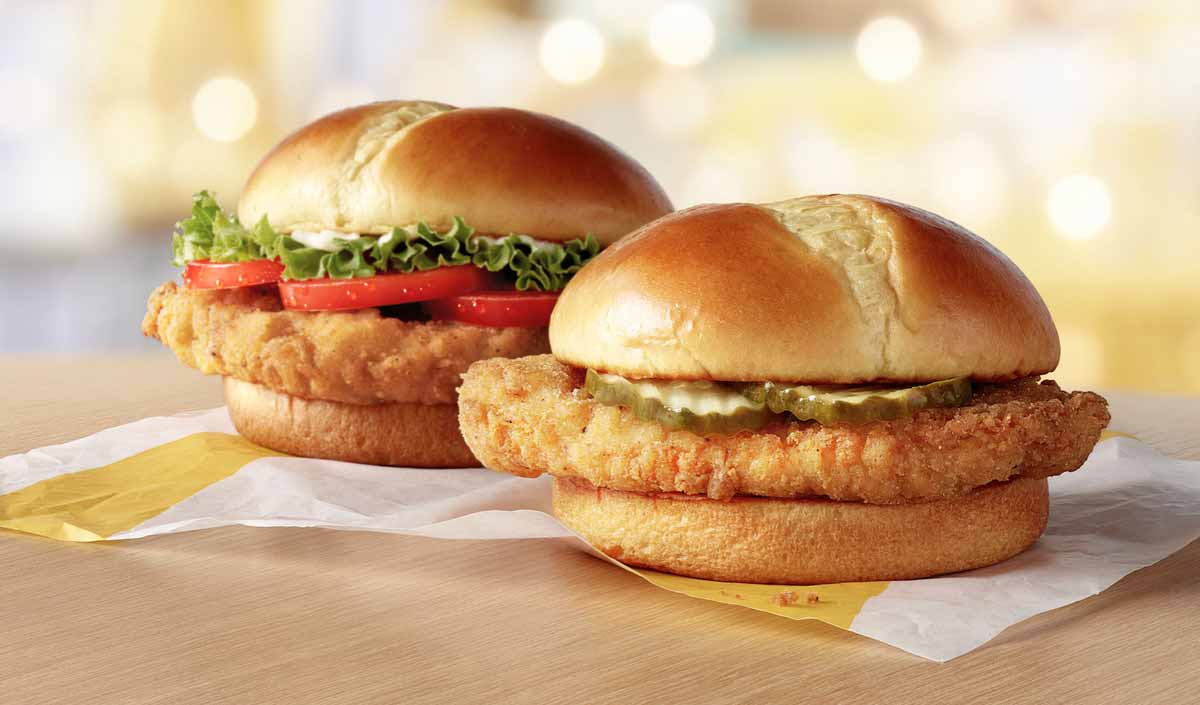
Just since December, five major chicken sandwich moves were made. Jack in the Box brought its “Cluck” product nationwide December 7. KFC rolled its massive sandwich on January 4. Bojangles introduced a Bo’s Chicken Sandwich to select markets in mid-February. McDonald’s three new crispy sandwiches launched February 24. Zaxby’s joined the party in early March after tests. And Taco Bell started piloting the “Crispy Chicken Sandwich Taco” in select areas on March 11.
For nearly every brand, sales trends improved post-launch.
Growth in spend per panelist, according to Sense360 data (relative percentage change versus 2019 equivalent weeks)
Jack in the Box
- Prior six weeks: 16 percent
- Weeks following launch (first four): 23 percent
- Net ppt change: 7
KFC
- Prior six weeks: 8 percent
- Weeks following launch (first four): 9 percent
- Net ppt change: 1
Bojangles
- Prior six weeks: 36 percent
- Weeks following launch (first four): 35 percent
- Net ppt change: –1 (only in select markets)
McDonald’s
- Prior six weeks: 22 percent
- Weeks following launch (first four): 32 percent
- Net ppt change: 10
Zaxby’s
- Prior six weeks: 12 percent
- Weeks following launch (first three): 20 percent
- Net ppt change: 9
Taco Bell
- Prior six weeks: 15 percent
- Weeks following launch (first two): 28 percent
- Net ppt change: 13
One thing to note as well, late February/early March launches likely received a stimulus bump, in addition to an overall improving market for restaurants.
However, with that said, here’s a look at McDonald’s. The wave continues to rise.
![]()
Below is a breakdown of the demographics fueling McDonald’s growth.
[image source_ID=”129553″]
And another way to look at it:

Analytics platform Placer.ai examined the fast-food giant’s results, too. It found McDonald’s launch date of its chicken sandwiches drove traffic up 19.1 percent, while the days that followed rose 29.1 and 21.5 percent, respectively. Saturday traffic witnessed a week-over-week bump of 12.4 percent, and Sunday saw a 13.8 percent increase.
The impact was even felt when observing year-over-year numbers, with the week of launch seeing visits down 29.4 percent—the brand’s best mark for in-store visits since September. And it came on the heels of an 18.3 percent week-over-week increase in visits.
During the week of February 22, visitor counts were down 29.4 percent, year-over-year, for McDonald’s. But that’s an improvement from being down north of 43.1 percent the week of January 25.
The launch was so significant, Placer.ai said, it “fundamentally changed the trajectory for McDonald’s.” Average daily visitors in February hiked 12.9 percent compared to January, and overall monthly visits in February rose 2 percent month-over-month despite the fact February has less overall days. All of this without taking into account McDonald’s delivery strength.
Chicken’s prominence has been building. In 2018, 65.2 pounds of chicken per person were available for Americans to eat (on a boneless, edible basis), compared to 54.6 pounds of beef. According to the USDA. Chicken began its upward climb in the 1940s, overtaking pork in 1996 as the second most consumed meat. Since 1970, U.S. chicken availability per person has more than doubled. In 2018, 16.1 pounds of fish and shellfish per person were available for consumption.
In February, in the year ending 2020, burgers were included in 13.5 percent of all restaurant orders, which translated to 7 billion servings of burgers, The NPD Group reported. Chicken sandwiches (breaded and grilled) were featured in 6.7 percent of all restaurant orders in the U.S, which amounted to 3.5 billion servings.
But while burgers remain the top entrée item orders, chicken sandwiches gained ground. Servings of breaded chicken sandwiches increased by 8 percent in the year ending December, compared to year-ago levels. This gain in servings contrasted with a double-digit decline in total restaurant visits in the year ending December 2020 versus year-ago. There were 2.5 billion breaded chicken sandwiches ordered from quick-service restaurants last year, up 9 percent from 2019.
One staggering figure to latch onto: Roughly 65 percent of the U.S. population ordered a breaded chicken sandwich from a quick-service restaurant in the last six months.
And if that isn’t something to hunt as a menu innovator or marketer, what is?
“No matter which chicken sandwich wins the chicken sandwich war or which sandwich is competing with the burger, operators who put chicken sandwiches or burgers or both on their menus are headed in the right direction,” David Portalatin, NPD Food Industry Advisor and author of Eating Patterns in America, said in a statement.