
The constant and steady uptick in the cost of ingredients, labor, rent, and more in recent years continues to place financial strain on restaurant owners. In response to these challenges, restaurants have raised prices to maintain profitability and ensure sustained service quality. Unsurprisingly, restaurants are seeing a corresponding increase in same-store sales. According to data from Black Box Intelligence, quick-service restaurants’ same-store sales rose 3.8 percent in November 2023. But pricing growth has slowed in recent months as restaurants acknowledge that they can’t raise prices in perpetuity.
WATCH THE WEBINAR: How to Measure the Health and Effectiveness of Your Loyalty Program
Basic economic principles indicate that if you increase prices, you’ll likely see a corresponding decrease in traffic. And we are seeing this play out across the industry—according to the same study from Black Box Intelligence, the 4.3 percent average check increase seen in November 2023 was partly offset by a 0.5 percent traffic drop. This leaves restaurants to answer the vital question: how much can we increase price before negatively impacting traffic and losing market share long-term? To answer that question, many jump to analyze sales figures. But doing so just raises more questions. Are sales up or down? If they’re up or neutral, can we raise prices more? And if they are down, how should we respond?
To truly measure the impact of price hikes on customer behavior, restaurant operators must evaluate how price increases are impacting the frequency of their guests—especially the frequency of the highest value customers: loyalty members.
MORE FROM THE AUTHOR: Why it’s Time to Pay Attention to Loyalty Capture Rate
One of the primary goals of a loyalty program is to measure and drive frequency—this is understood universally. But loyalty tools are often elusive or misleading about how much the loyalty program is actually contributing to a shift in member behavior. Many of these tools offer vanity metrics like “frequency of non-members vs. members.” These comparison metrics are problematic because they’re subject to selection bias. Your loyalty members are—by definition—the customers most likely to come in regularly. Loyalty program providers also may share data like “frequency lift from period A to period B,” but these metrics are heavily influenced by factors that are external to your program’s influence. For example, what happens if you open a restaurant in a new geographical location? All of those newly acquired customers who make a single purchase during your grand opening will drag down your average, which could cause you to inaccurately conclude that there is a problem.
So, what is the right way to measure customer frequency?
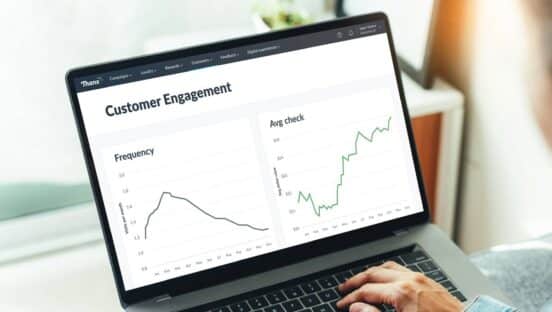
In order to measure frequency and how it’s changing over time as the result of adaptations to your loyalty program (such as adding a new perk to the rewards marketplace or updating your tier incentives), you must first isolate your Engaged Customers (at Thanx, defined as customers who have made at least 3 purchases total and at least 1 purchase in the last 90 days). This allows you to remove the bias introduced through new location openings or long-tenured programs with a high number of churned members. Now that you have isolated this cohort, it’s much easier to measure frequency changes over time. It’s important to note that seasonality and other macroeconomic factors will always be at play, but now you can at least see how guest frequency is changing in a more controlled fashion.
Now, to get back to the original question, increasing price will absolutely impact frequency—so you need to look not just at frequency but also at how frequency is impacted alongside average check to understand whether the net impact is positive or negative. For this, Thanx recommends using a figure known as “Average Monthly Value.” Average Monthly Value (AMV) measures the average monthly spend of your Engaged Customers and gives insight into how much revenue, on average, your Engaged Customers contribute monthly to your business. Put another way, it’s your engaged member’s average check multiplied by their average monthly frequency.
Average Monthly Value tells you the relationship between average check and frequency in a single metric. If your AMV is up (even if frequency is down), you may be positively impacting guest behavior. If your AMV is down, then your price increases may be negatively impacting guest frequency. Once those guests depart from their normal behavior patterns, it can be difficult to get them to resume, which is why it’s so important to identify this behavior shift right away—as soon as new prices are put in place.
Beyond reducing prices again, there are many ways to improve AMV. As many restaurant operators know all too well, 60–70 percent of revenue comes from roughly 20 percent of customers. That 20 percent of customers can swing the numbers significantly. That’s why we recommend the following:
- Encourage and reward specific desired behaviors: For example, if your average monthly frequency is one visit per month, target guests who have average or lower than average frequency and encourage them to come in twice this month.
- Constantly evolve your loyalty program: Add new perks to your Points Marketplace to keep things fresh and to ensure relevance to as many members as possible.
- Lock in member spending with Stored Value: Drive spending in advance of purchase with pre-loaded funds.
- A/B test automated campaigns: Create A/B tests on targeted campaigns to engage customers while also better understanding what messaging and incentives work best.
The evaluation of your Average Monthly Value goes beyond frequency lift or spend lift to give you insight into how often your Engaged Customers visit as well as how much they spend on average. It’s also a single metric for understanding the health of your Engaged Customers, which adds contextual data to your next pricing move. This is the crux of understanding if your loyalty program is working—after all, it’s Engaged Customers who have an outsized impact on revenue. And while there are many ways to measure how engaged your Engaged Customers are, the most comprehensive and unbiased one is “Average Monthly Value.”
Zach Goldstein is the CEO and Founder of Thanx. Founded in 2011, Thanx is a leading guest engagement and retention platform helping restaurants and retailers become more digitally agile to maximize customer lifetime value. Prior to earning his MBA from Stanford, Goldstein honed his experience in the customer loyalty space at Bain & Company, helping companies perfect their retention and reward strategies as early as 2005.