Chick-fil-A restaurant.
Panera restaurant.
Taco Bell restaurant.
Bojangles prototype.

Every year, the QSR 50 offers a snapshot of the brands generating the most business across the U.S. quick-service restaurant industry. Systemwide sales determine the ranking, but other measures provide a deeper look at how the largest chains are performing.

Average unit volume, or AUV, is one of the most useful. The metric shows how much revenue the typical restaurant generates over the course of a year, providing context that total sales alone can’t capture. AUV can help illustrate restaurant-level productivity, compare concepts of vastly different sizes, and show whether a brand’s growth is being supported by strong individual stores.

Here’s a look at the top 20 U.S. quick-service chains that earn the most per restaurant. These rankings are based off the 50 highest-grossing brands in America.

Click here for a free download of the entire QSR 50 and brand-by-brand breakdown.

Note: If viewing on desktop, please click the arrow in the picture to continue. * Indicates estimate by QSR. Numbers are year-end 2025 U.S. stores.
1. Chick-fil-A*

Average sales per unit (thousands): $7,700

Unit count: 3,287

Franchised stores: 3,219

Company stores: 68

Total change in units from 2024: 178

U.S. systemwide sales (millions): $23,918


Click here for a free download of the entire QSR 50 and brand-by-brand breakdown.

And for a more in-depth breakdown on Chick-fil-A’s earnings, click here.

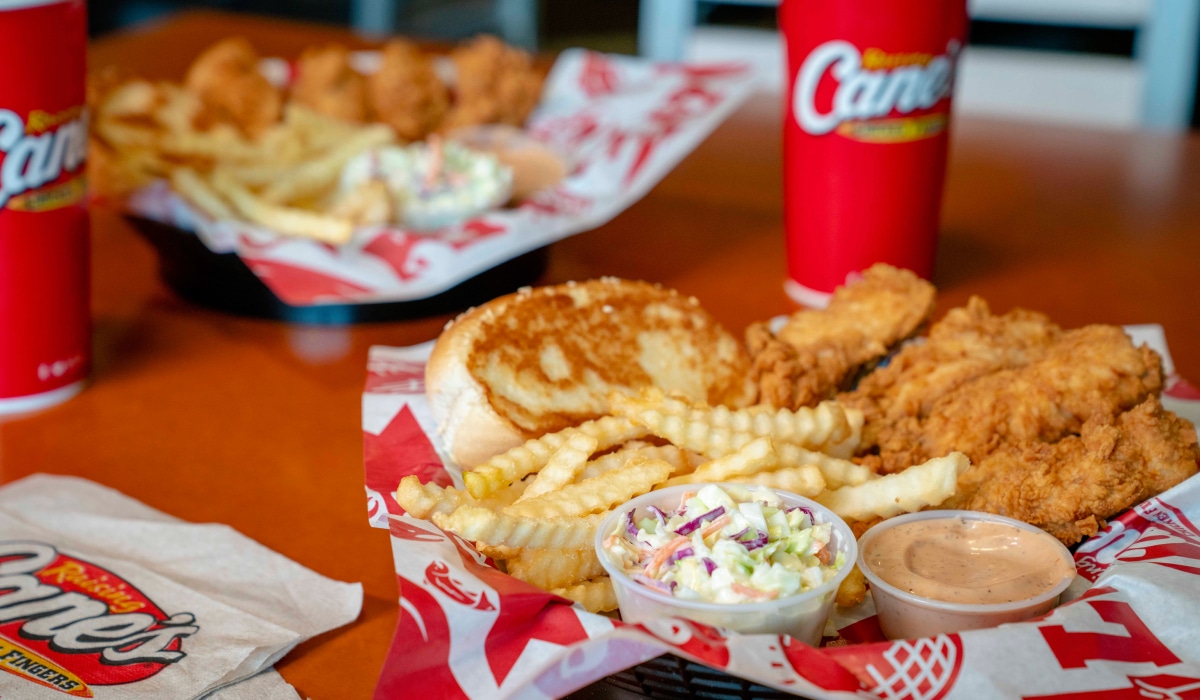
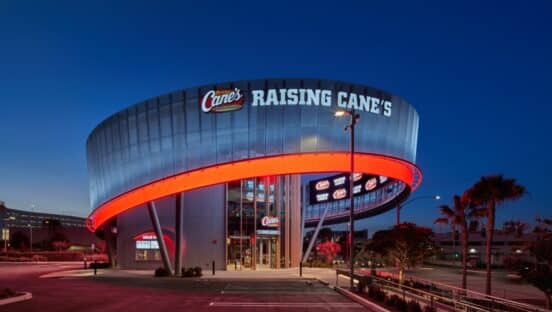
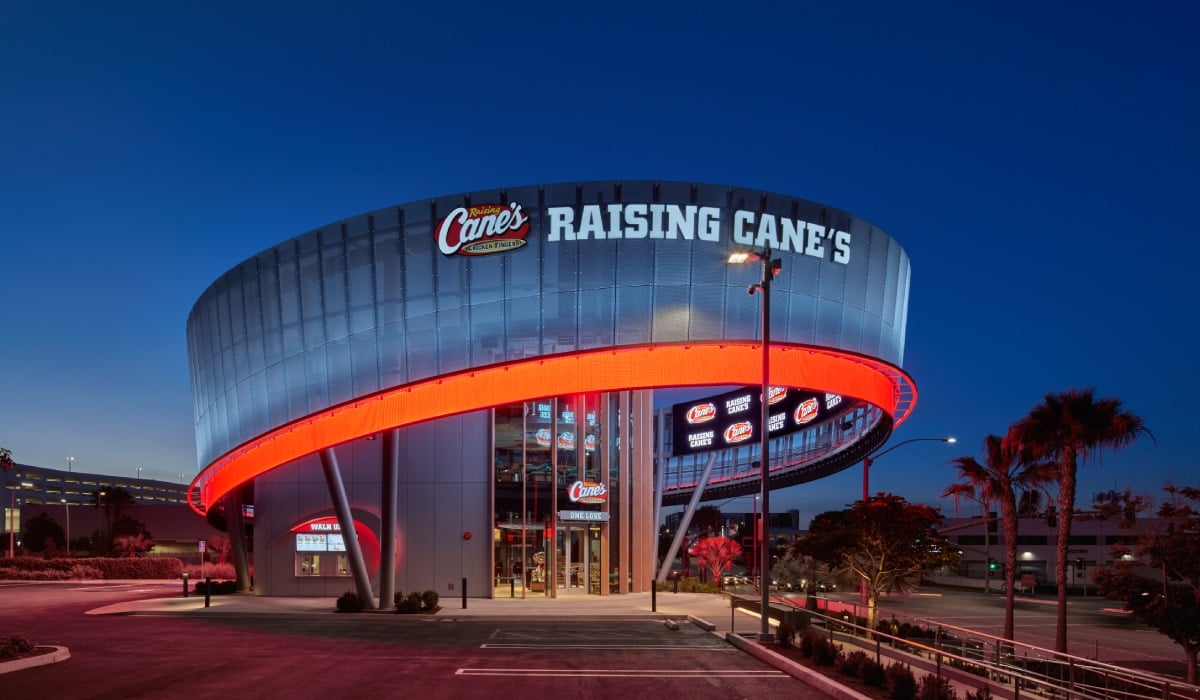
2. Raising Cane's

Average sales per unit (thousands): $6,580

Unit count: 913

Franchised stores: 22

Company stores: 891

Total change in units from 2024: 92

U.S. systemwide sales (millions): $5,487


Click here for a free download of the entire QSR 50 and brand-by-brand breakdown.


3. In-N-Out*

Average sales per unit (thousands): $6,032

Unit count: 431

Franchised stores: 0

Company stores: 431

Total change in units from 2024: 16

U.S. systemwide sales (millions): $2,600


Click here for a free download of the entire QSR 50 and brand-by-brand breakdown.


4. McDonald's

Average sales per unit (thousands): $4,088

Unit count: 13,706

Franchised stores: 13,062

Company stores: 644

Total change in units from 2024: 147

U.S. systemwide sales (millions): $55,061


Click here for a free download of the entire QSR 50 and brand-by-brand breakdown.

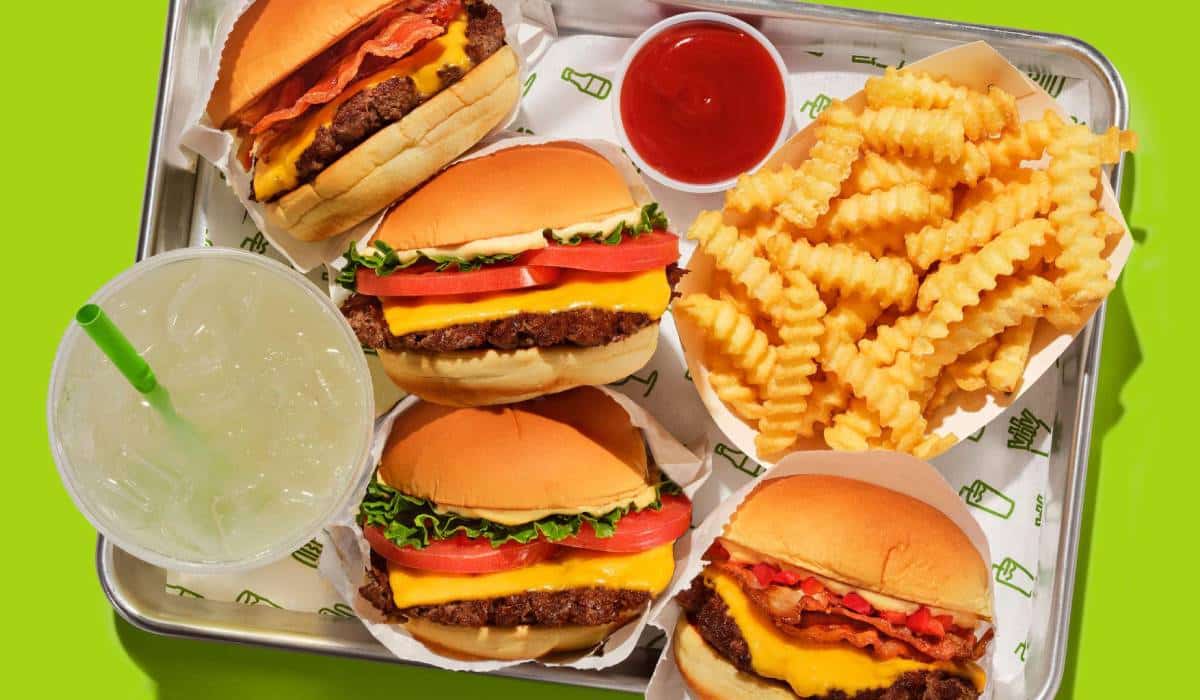
5. Shake Shack*

Average sales per unit (thousands): $4,048

Unit count: 420

Franchised stores: 47

Company stores: 373

Total change in units from 2024: 47

U.S. systemwide sales (millions): $1,541


Click here for a free download of the entire QSR 50 and brand-by-brand breakdown.

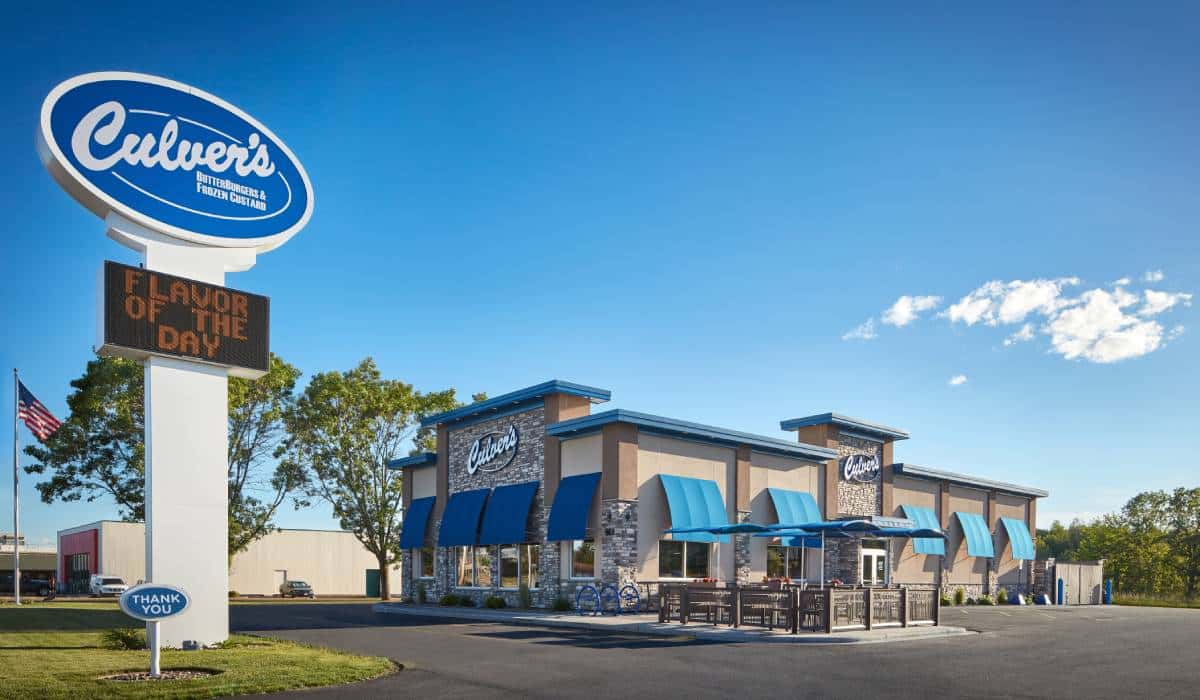
6. Culver's

Average sales per unit (thousands): $4,040

Unit count: 1,041

Franchised stores: 1,034

Company stores: 7

Total change in units from 2024: 44

U.S. systemwide sales (millions): $4,200


Click here for a free download of the entire QSR 50 and brand-by-brand breakdown.

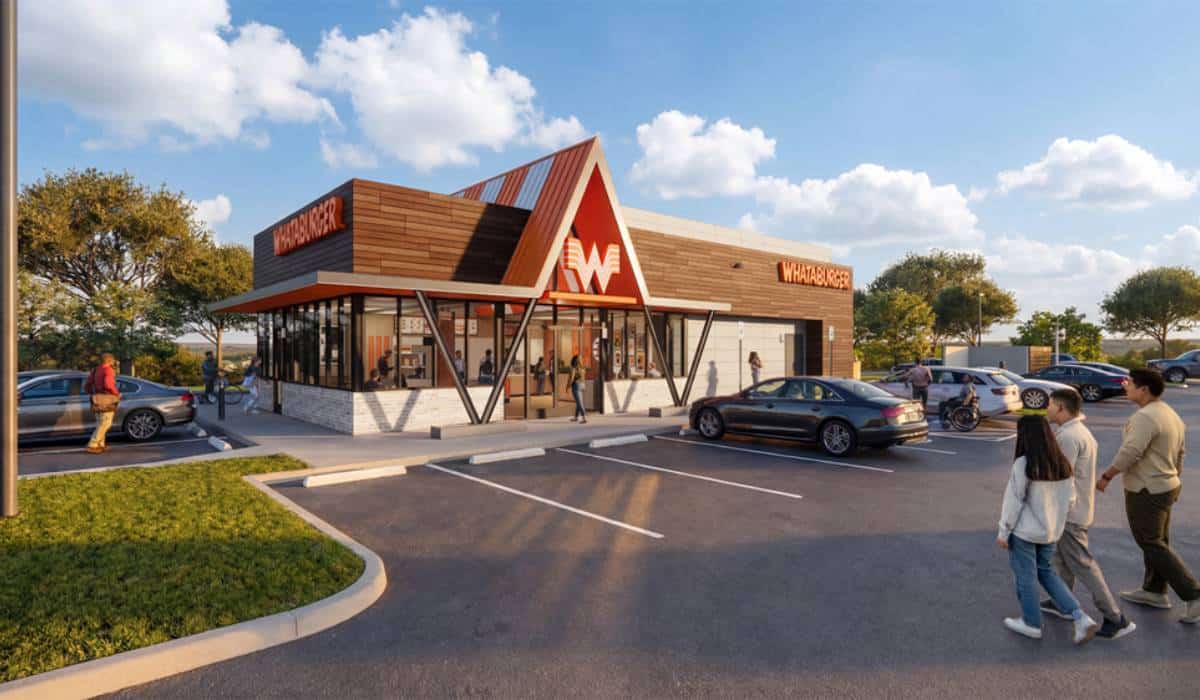
7. Whataburger

Average sales per unit (thousands): $3,914

Unit count: 1,161

Franchised stores: 253

Company stores: 908

Total change in units from 2024: 76

U.S. systemwide sales (millions): $4,311


Click here for a free download of the entire QSR 50 and brand-by-brand breakdown.

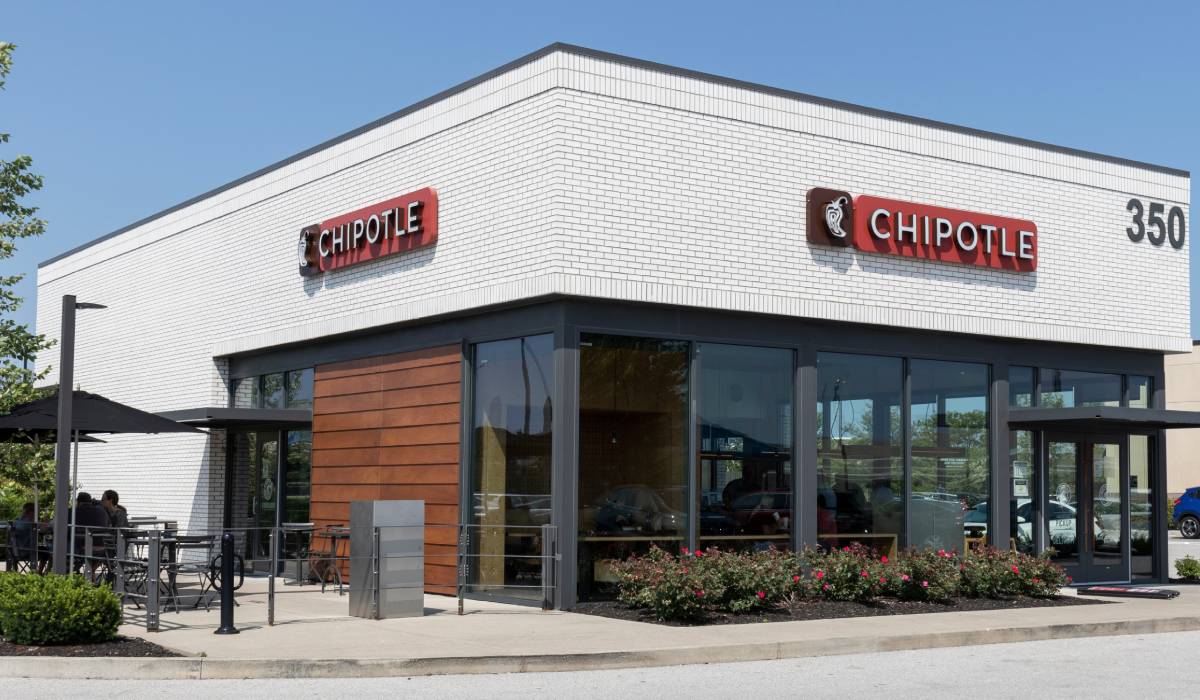
8. Chipotle

Average sales per unit (thousands): $3,104

Unit count: 3,938

Franchised stores: 0

Company stores: 3,938

Total change in units from 2024: 294

U.S. systemwide sales (millions): $11,679


Click here for a free download of the entire QSR 50 and brand-by-brand breakdown.

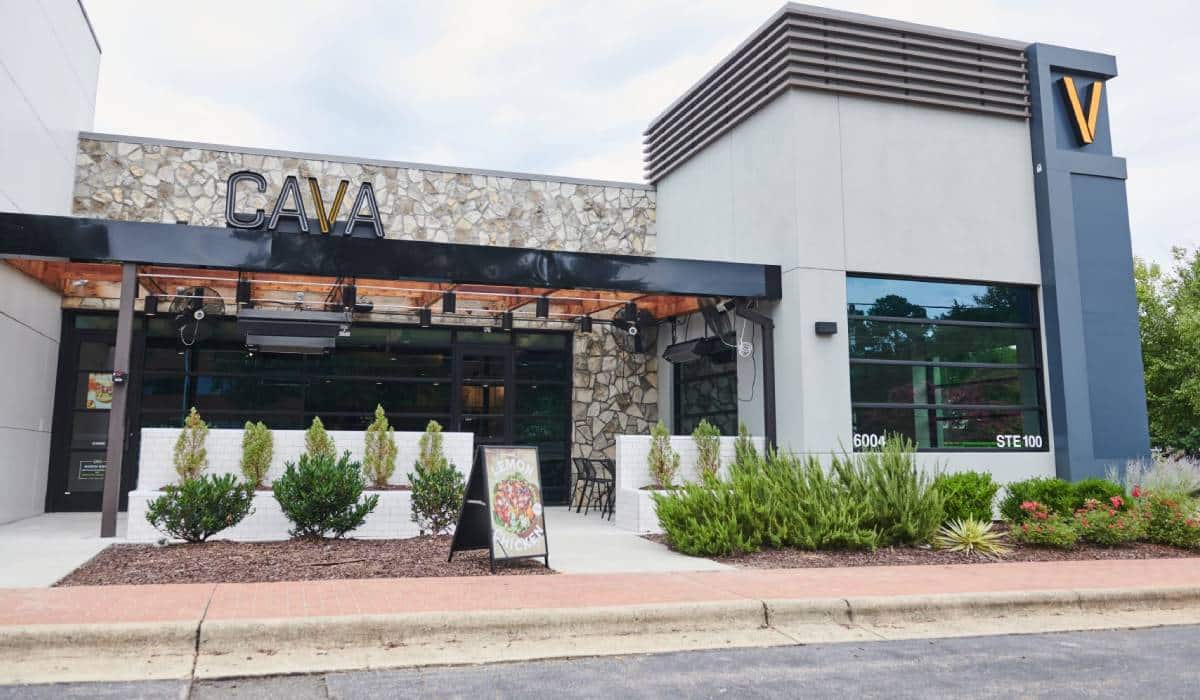
9. CAVA

Average sales per unit (thousands): $2,934

Unit count: 439

Franchised stores: 0

Company stores: 439

Total change in units from 2024: 72

U.S. systemwide sales (millions): $1,169


Click here for a free download of the entire QSR 50 and brand-by-brand breakdown.

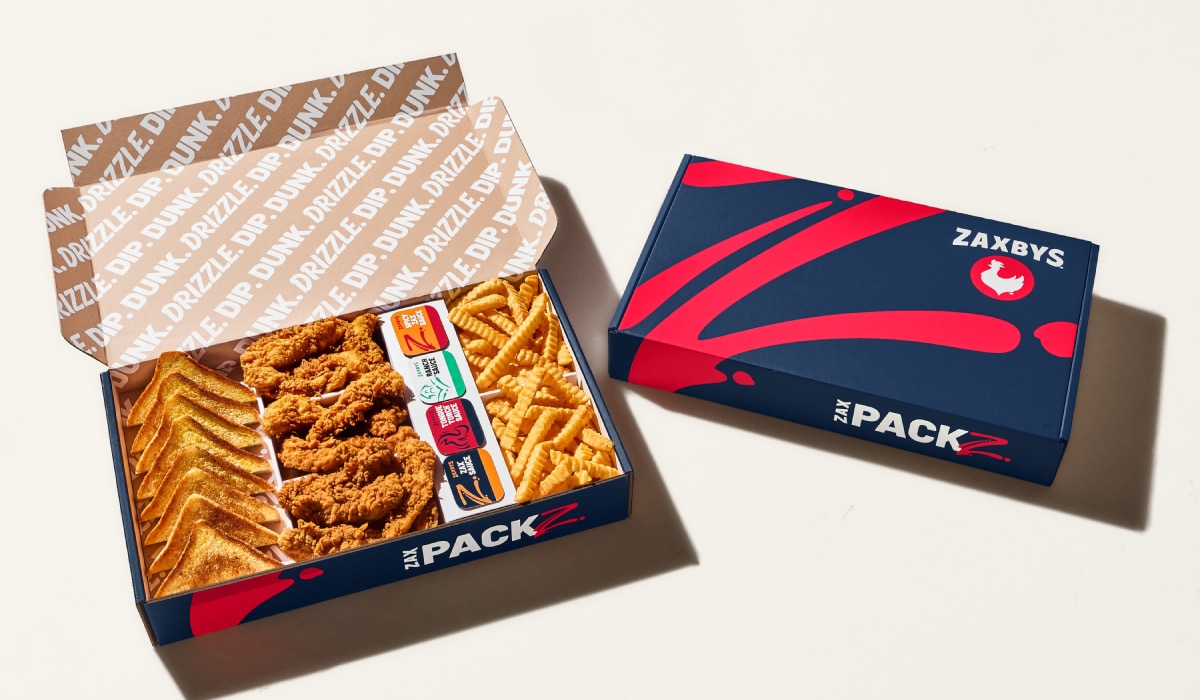
10. Zaxbys

Average sales per unit (thousands): $2,768

Unit count: 1,005

Franchised stores: 865

Company stores: 140

Total change in units from 2024: 36

U.S. systemwide sales (millions): $2,764


Click here for a free download of the entire QSR 50 and brand-by-brand breakdown.

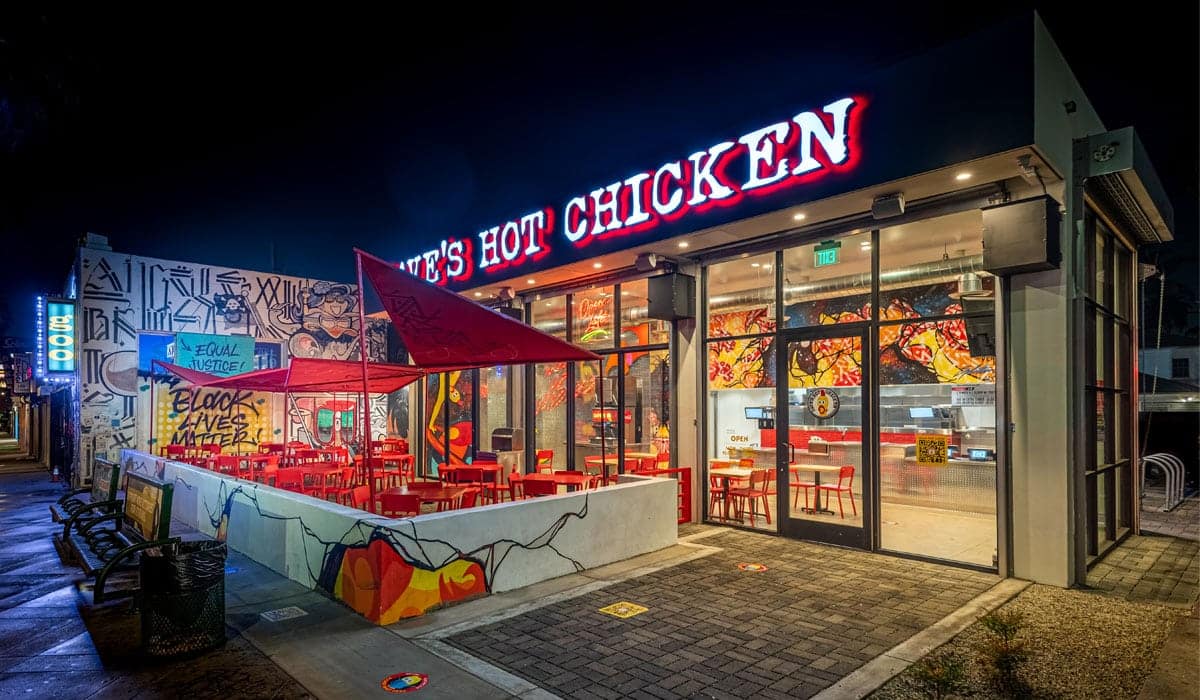
11. Dave's Hot Chicken

Average sales per unit (thousands): $2,718

Unit count: 358

Franchised stores: 348

Company stores: 10

Total change in units from 2024: 120

U.S. systemwide sales (millions): $966


Click here for a free download of the entire QSR 50 and brand-by-brand breakdown.

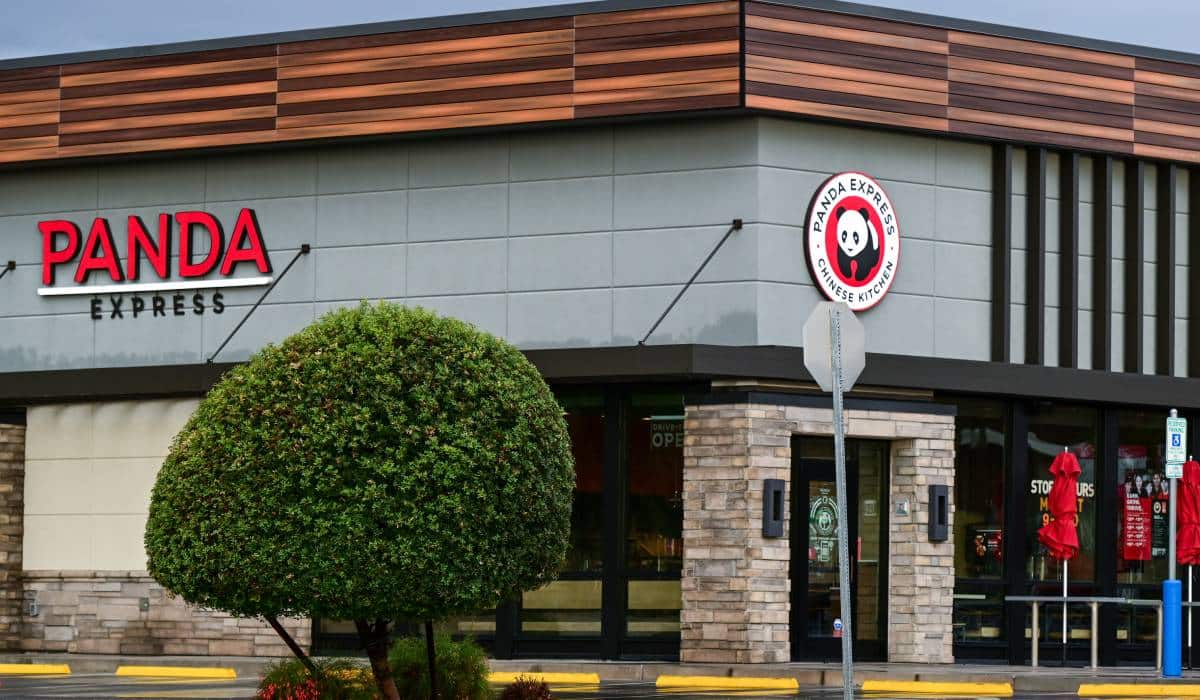
12. Panda Express

Average sales per unit (thousands): $2,646

Unit count: 2,607

Franchised stores: 185

Company stores: 2,422

Total change in units from 2024: 102

U.S. systemwide sales (millions): $6,408


Click here for a free download of the entire QSR 50 and brand-by-brand breakdown.

13. Panera*

Average sales per unit (thousands): $2,611

Unit count: 2,214

Franchised stores: 1,106

Company stores: 1,108

Total change in units from 2024: 29

U.S. systemwide sales (millions): $5,894


Click here for a free download of the entire QSR 50 and brand-by-brand breakdown.

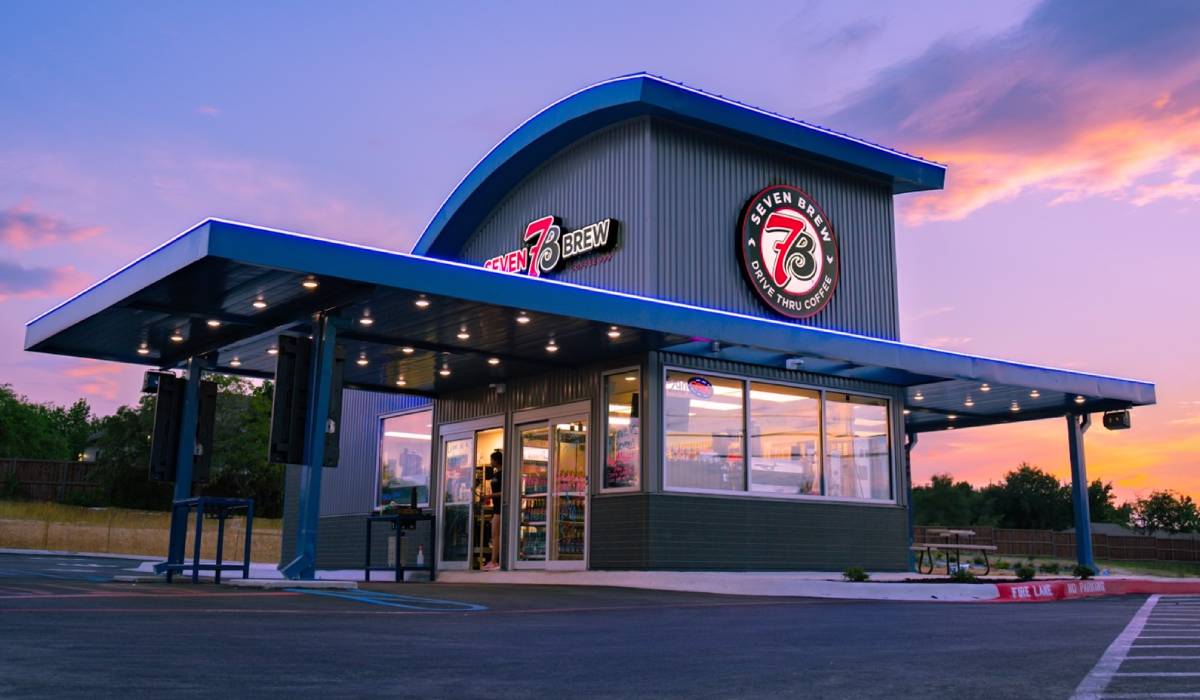
14. 7 Brew

Average sales per unit (thousands): $2,600

Unit count: 602

Franchised stores: 578

Company stores: 24

Total change in units from 2024: 281

U.S. systemwide sales (millions): $1,200


Click here for a free download of the entire QSR 50 and brand-by-brand breakdown.

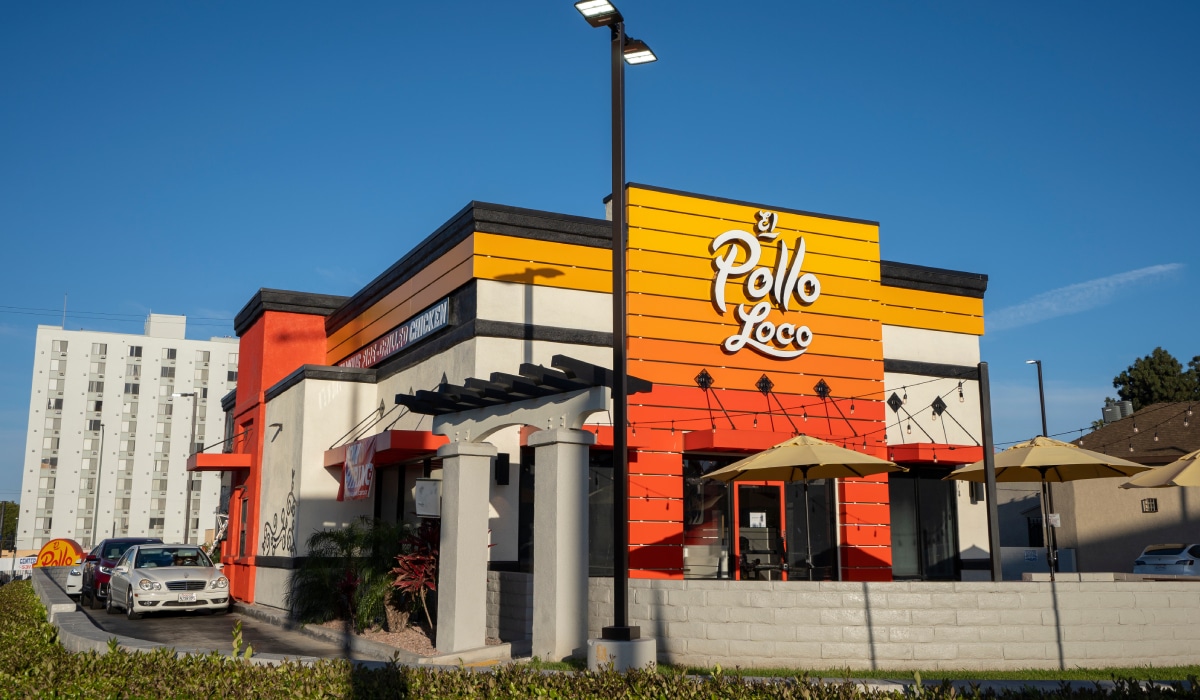
15. El Pollo Loco

Average sales per unit (thousands): $2,300

Unit count: 503

Franchised stores: 328

Company stores: 175

Total change in units from 2024: 5

U.S. systemwide sales (millions): $1,125


Click here for a free download of the entire QSR 50 and brand-by-brand breakdown.

16. Taco Bell

Average sales per unit (thousands): $2,216

Unit count: 7,784

Franchised stores: 7,124

Company stores: 660

Total change in units from 2024: 180

U.S. systemwide sales (millions): $17,247


Click here for a free download of the entire QSR 50 and brand-by-brand breakdown.

17. Bojangles

Average sales per unit (thousands): $2,156

Unit count: 867

Franchised stores: 591

Company stores: 276

Total change in units from 2024: 37

U.S. systemwide sales (millions): $1,948


Click here for a free download of the entire QSR 50 and brand-by-brand breakdown.

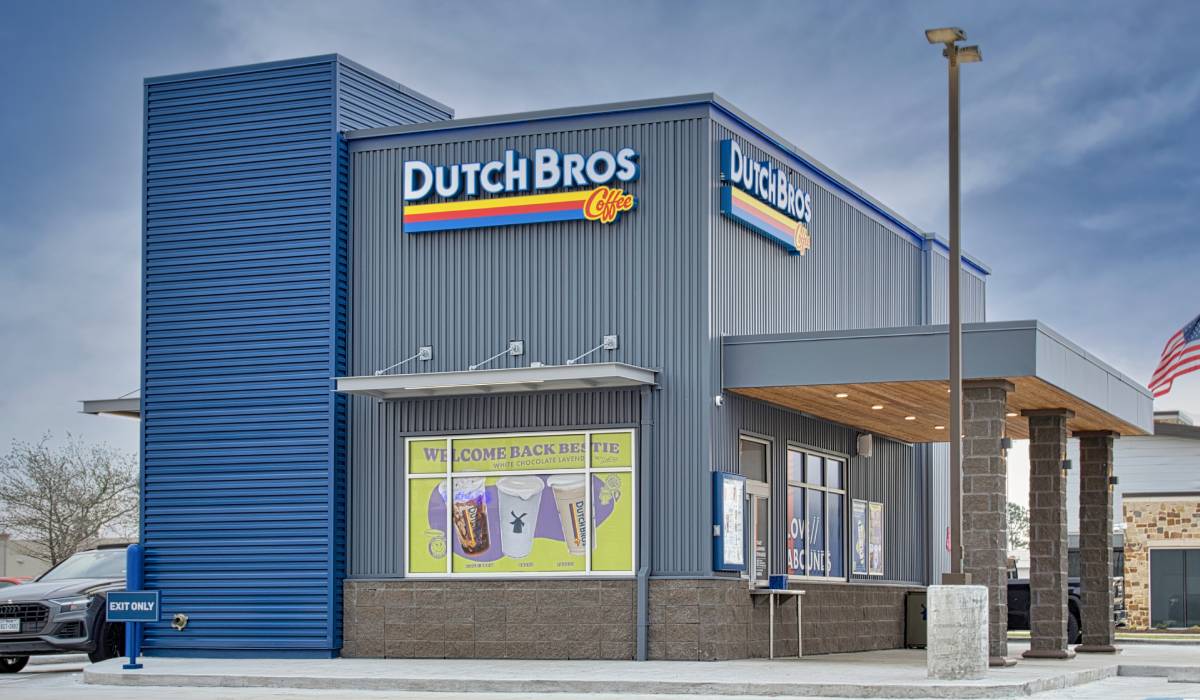
18. Dutch Bros

Average sales per unit (thousands): $2,115

Unit count: 1,136

Franchised stores: 325

Company stores: 811

Total change in units from 2024: 154

U.S. systemwide sales (millions): $2,224


Click here for a free download of the entire QSR 50 and brand-by-brand breakdown.

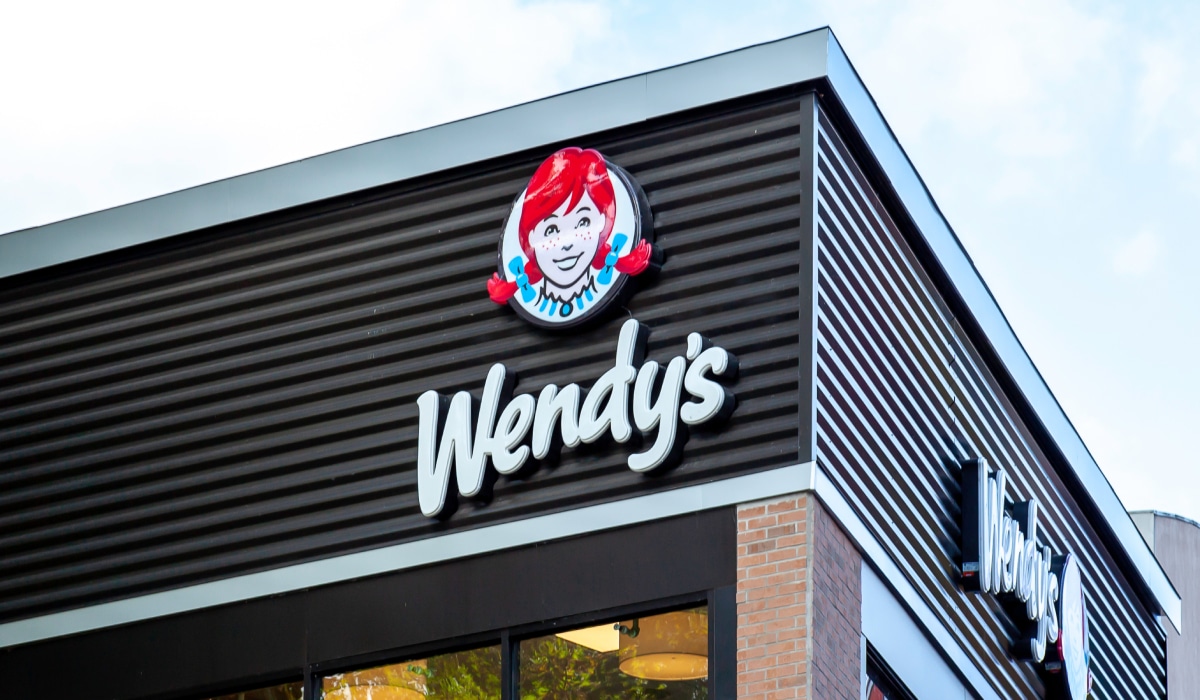
19. Wendy's

Average sales per unit (thousands): $2,001

Unit count: 5,969

Franchised stores: 5546

Company stores: 423

Total change in units from 2024: 36

U.S. systemwide sales (millions): $11,898


Click here for a free download of the entire QSR 50 and brand-by-brand breakdown.

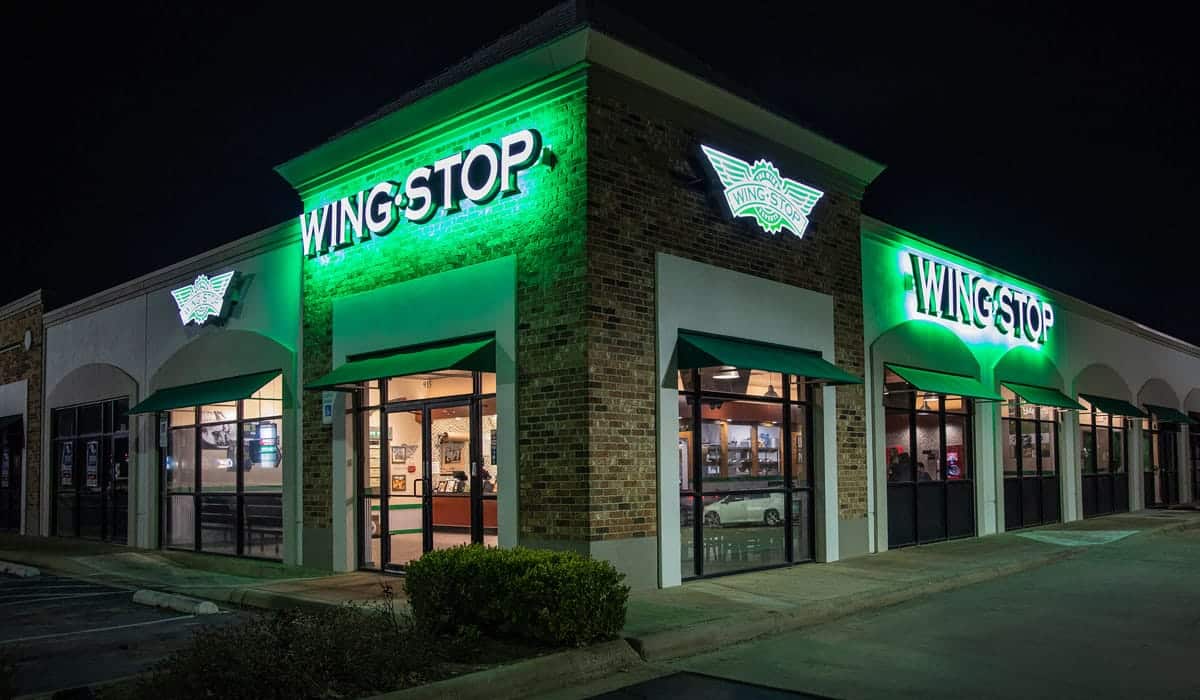
20. Wingstop

Average sales per unit (thousands): $2,000

Unit count: 2,586

Franchised stores: 2,529

Company stores: 57

Total change in units from 2024: 382

U.S. systemwide sales (millions): $5,343


Click here for a free download of the entire QSR 50 and brand-by-brand breakdown.

QSR Slideshow, Story