| QSR 50 Profiles | Segments | |
| The Charts | Burger | Pizza/Pasta |
| Top 50 | Sandwich | Chicken |
| Top 50 by Units | Snack | Asian & Seafood |
| Video Report | Mexican |
The much-anticipated annual QSR 50 ranking is here, and Yum Brands dominated each segment it competed in. Of the eight food categories, Yum Brands had the No. 1 spot in four.
Those winners were Taco Bell for the Mexican segment, KFC for the chicken category, Pizza Hut for the Pizza and Pasta brands, and Long John Silver's winning the Seafood segment.
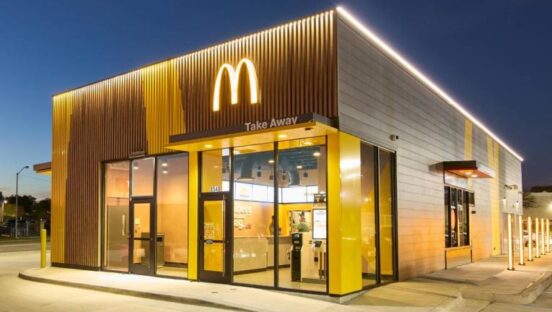
Overall the biggest segment leader was McDonald's at the top of the burger category. The company took the No. 1 spot overall and the No. 1 spot in the burger category with more than $32 billion in systemwide sales in fiscal 2010.
| Segment Rank | QSR 50 Rank | Company | 2010 U.S. Systemwide Sales (millions) | 2010 U.S. Average Sales per Unit (thousands) | Total Units in 2010 | Total Change in Units from 2009 |
|
1
|
1 | McDonald's | $32,395.0 | $2,400.0 | 14,027 | 47 |
|
2
|
3 | Burger King*2 | $8,600.0 | $1,230.0 | 7,253 | 3 |
|
3
|
4 | Wendy's* | $8,340.0 | $1,418.0 | 6,576 | 35 |
|
4
|
10 | Sonic | $3,619.9 | $1,023.0 | 3572 | 28 |
|
5
|
15 | Jack in the Box | $2,934.8 | $1,322.0 | 2,206 | -6 |
|
6
|
16 | Dairy Queen* | $2,660.0 | $540.0 | 4514 | -25 |
|
7
|
19 | Hardee's* | $1,695.00 | $1,054.0 | 1692 | -64 |
|
8
|
23 | Carl's Jr.* | $1,310.0 | $1,375.0 | 1097 | 11 |
|
9
|
25 | Whataburger | $1,225.7 | $1,709.0 | 717 | 15 |
|
10
|
27 | Steak-N-Shake* | $786.6 | $1,590.0 | 487 | 2 |
|
11
|
30 | Five Guys Burgers & Fries | $716.0 | $1,139.0 | 736 | 195 |
|
12
|
33 | Culver's | $689.1 | $1,641.2 | 424 | 11 |
|
13
|
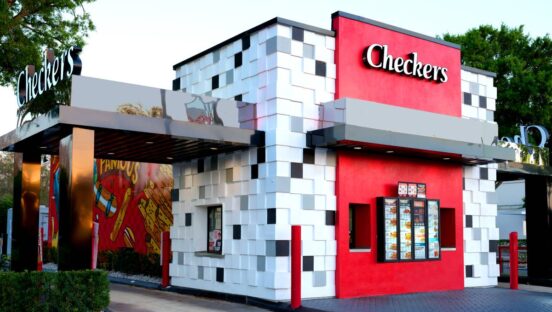
34 | Checkers/Rally's | $658.7 | $830.4 | 804 | -16 |
|
14
|
40 | White Castle* | $542.1 | $1,300.0 | 416 | -2 |
|
15
|
45 | In-N-Out Burger* | $472.5 | $1,925.0 | 252 | 13 |
|
16
|
50 | Krystal* | $377.3 | $1,036.0 | 364 | -20 |
| Segment Rank | QSR 50 Rank | Company | 2010 U.S. Systemwide Sales (millions) | 2010 U.S. Average Sales per Unit (thousands) | Total Units in 2010 | Total Change in Units from 2009 |
|
1
|
2 | Subway* | $10,600.0 | $452.0 | 23,850 | 816 |
|
2
|
13 | Panera Bread | $3,100.0 | $2,200.0 | 1,453 | 73 |
|
3
|
14 | Arby's | $3,010.0 | $838.0 | 3,649 | -69 |
|
4
|
21 | Quiznos* | $1,430.0 | $420.0 | 3103 | -600 |
|
5
|
29 | Jimmy John's* | $735.0 | $753.0 | 1131 | 162 |
|
6
|
42 | Jason's Deli | $503.2 | $2,226.6 | 226 | 11 |
|
7
|
48 | Einstein Bros. Bagels* | $400.4 | $988.0 | 583 | 51 |
| Segment Rank | QSR 50 Rank | Company | 2010 U.S. Systemwide Sales (millions) | 2010 U.S. Average Sales per Unit (thousands) | Total Units in 2010 | Total Change in Units from 2009 |
|
1
|
5 | Starbucks* | $7,560.0 | $1,060.0 | 11,131 | 0 |
|
2
|
7 | Dunkin' Donuts* | $6,000.0 | $839.0 | 6,772 | 206 |
|
3
|
37 | Baskin Robbins* | $565.0 | $220.0 | 2600 | 55 |
|
4
|
46 | Tim Hortons1 | $439.2 | $978.0 | 602 | 39 |
|
5
|
49 | Cold Stone Creamery | $385.7 | $344.0 | 1122 | 76 |
*Includes figures estimated by Technomic, Inc.
1. Systemwide sales from franchised units only
2. Total change in units calculated from data reported in 2010 QSR 50
[pagebreak]
| QSR 50 Profiles | Segments | |
| The Charts | Burger | Pizza/Pasta |
| Top 50 | Sandwich | Chicken |
| Top 50 by Units | Snack | Asian & Seafood |
| Video Report | Mexican |
Yum Brands dominated each segment it competed in this year. Of the eight food categories, Yum Brands had the No. 1 spot in four those.
Those winners were Taco Bell for the Mexican segment, KFC for the chicken category, Pizza Hut for the Pizza and Pasta brands, and Long John Silver's winning the Seafood segment.
| Segment Rank | QSR 50 Rank | Company | 2010 U.S. Systemwide Sales (millions) | 2010 U.S. Average Sales per Unit (thousands) | Total Units in 2010 | Total Change in Units from 2009 |
|
1
|
6 | Taco Bell | $6,900.0 | $1,288.0 | 5,634 | 30 |
|
2
|
18 | Chipotle | $1,840.0 | $1,800.0 | 1084 | 129 |
|
3
|
36 | Del Taco | $579.0 | $1,100.0 | 522 | 6 |
|
4
|
44 | Qdoba | $480.8 | $883.0 | 525 | 15 |
| Segment Rank | QSR 50 Rank | Company | 2010 U.S. Systemwide Sales (millions) | 2010 U.S. Average Sales per Unit (thousands) | Total Units in 2010 | Total Change in Units from 2009 |
|
1
|
8 | Pizza Hut | $5,400.0 | $855.0 | 7,542 | -24 |
|
2
|
12 | Domino's Pizza* | $3,305.6 | $657.0 | 4929 | 2 |
|
3
|
17 | Papa John's | $2,081.8 | $863.0 | 2871 | 90 |
|
4
|
24 | Little Caesars* | $1,253.0 | $460.0 | 2800 | 152 |
|
5
|
35 | Papa Murphy's | $648.8 | $538.5 | 1,255 | 84 |
|
6
|
39 | CiCi's Pizza* | $545.0 | $906.0 | 594 | -31 |
|
7
|
43 | Sbarro* | $501.5 | $623.0 | 778 | -7 |
| Segment Rank | QSR 50 Rank | Company | 2010 U.S. Systemwide Sales (millions) | 2010 U.S. Average Sales per Unit (thousands) | Total Units in 2010 | Total Change in Units from 2009 |
|
1
|
9 | KFC | $4,700.0 | $933.0 | 5,055 | -107 |
|
2
|
11 | Chick-fil-A | $3,582.5 | $2,694.4 | 1537 | 57 |
|
3
|
20 | Popeyes* | $1,635.0 | $1,053.0 | 1,580 | 34 |
|
4
|
26 | Church's Chicken | $872.7 | $695.0 | 1250 | 24 |
|
5
|
28 | Zaxby's | $777.6 | $1,548.0 | 514 | 22 |
|
6
|
31 | Bojangles' | $712.8 | $1,573.3 | 484 | 27 |
|
7
|
38 | El Pollo Loco | $557.0 | $1,400.0 | 412 | -3 |
|
8
|
41 | Boston Market* | $513.0 | $1,015.0 | 491 | -29 |
| Segment Rank | QSR 50 Rank | Company | 2010 U.S. Systemwide Sales (millions) | 2010 U.S. Average Sales per Unit (thousands) | Total Units in 2010 | Total Change in Units from 2009 |
|
1
|
22 | Panda Express | $1,404.5 | $1,093.5 | 1336 | 62 |
| Segment Rank | QSR 50 Rank | Company | 2010 U.S. Systemwide Sales (millions) | 2010 U.S. Average Sales per Unit (thousands) | Total Units in 2010 | Total Change in Units from 2009 |
|
1
|
32 | Long John Silver's* | $700.0 | $655.0 | 964 | -25 |
|
2
|
47 | Captain D's | $436.2 | $819.0 | 531 | -4 |
*Includes figures estimated by Technomic, Inc.
1. Systemwide sales from franchised units only
2. Total change in units calculated from data reported in 2010 QSR 50