


Pretzelmaker, owned by FAT Brands Inc. and innovator of Pretzel Bites, is once again rolling out Free Pretzel Bites to celebrate National Pretzel Day. This National Pretzel Day, April 26, fans can grab one free Small Original Pretzel Bites, Original Salted or Unsalted, in-store at participating Pretzelmaker locations nationwide. “Offering a great deal for National Pretzel Day is a longstanding tradition at Pretzelmaker,” says […]
Wetzel’s Pretzels (Wetzel’s), the nation’s fun-loving pretzel brand, recently expanded in Aurora, and pretzels are the first thing on Walmart shoppers’ lists. The new bakery will be owned and operated by one of Wetzel’s distinguished ‘Access to Equity’ entrepreneurs and restaurant industry veteran, Juveisa Prada. The brand’s Access to Equity program was created to improve inclusivity for women and minorities […]
Baristas at The Human Bean will begin pouring coffee and other specialty beverages at 101 Midland Ave beginning this Tuesday, April 16th. Customers are invited to come get a first taste of the Cafe’s offerings, including specialty-grade coffee, real-fruit smoothies, whole-leaf teas, and hot breakfast items to-go. Local owners of the new The Human Bean location, […]
The Human Bean is hosting its annual Earth Day Giveback at all locations across the U.S. next Monday, April 22nd. On this special day, every drink sold will result in one tree planted through Trees for the Future, an international nonprofit with 30+ years of history planting trees and teaching sustainable farming practices in impoverished communities. […]
Popeyes is elevating the holiday with a smokin’ deal and a new Munchies Menu that’s sure to satisfy all cravings. Starting today through Saturday, 4/20, guests can order off the Munchies Menu and get a mouthwatering Chicken Sandwich (Classic, Spicy, Blackened or Spicy Blackened) for only $4.20 and fan-favorite sides like Cajun Fries, Mac & Cheese, Mashed Potatoes and more for […]
Bojangles, the Carolina-born restaurant chain specializing in craveable breakfast and Southern-style chicken, biscuits and tea, has announced the signing of a 30-unit agreement that will bring the concept to Los Angeles for the first time. The agreement, spearheaded by seasoned entrepreneur Lorenzo Boucetta and Poulet Brothers, LLC, is expected to introduce Bojangles to Los Angeles […]
Revel Systems, an open cloud order management platform for restaurant and retail brands, announced that Black Rock Coffee Bar has successfully implemented Revel at more than 130 locations, with plans to rapidly expand nationwide. Preferring a best-of-breed approach to its technology stack, Black Rock took advantage of Revel’s existing integrations with leading solutions for loyalty, […]

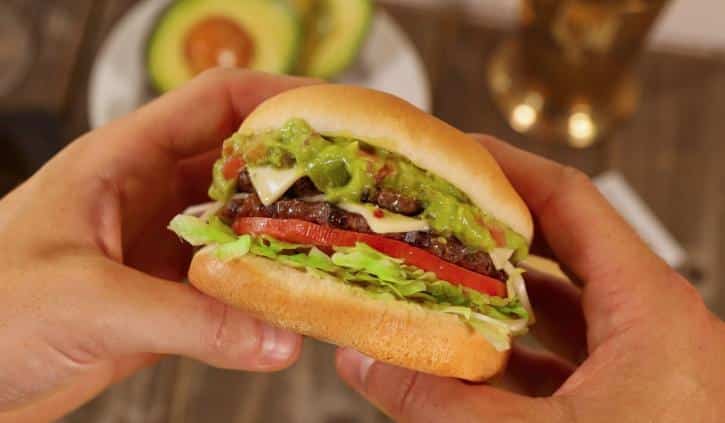
Smashburger announced the signing of an agreement with existing franchisee, Sachi Foods, LLC, to expand their partnership. Led by Farhana Ali, the deal awards the group two Salt Lake City-based restaurants, growing its portfolio to 15 operating locations between the United States of America and Costa Rica. The announcement comes on the heels of Smashburger’s […]
Subscribe to A.M. Jolt
"*" indicates required fields