There aren’t many, but one consistent trend during COVID-19 is pizza outperformance. The why isn’t complicated: Pizza brands came into the crisis, on a broad scale, already equipped to deliver and fulfill carryout service. No pivot needed.
It was ingrained not just in their operations, either, but in core consumer behavior as well. The latter factor might just be the more critical, given the scale of restaurants catching up and the sales gap that still remains.
According to an earlier report from Datassential, 63 percent of customers said they sought out pizza during the pandemic. Burgers and sandwiches were a distant second at 51 percent.
READ MORE:
Pizza chains are hiring during the crisis
STAY UP TO DATE WITH OUR CORONAVIRUS LANDING PAGE
Once COVID-19 kicked into gear in mid-March, a pattern formed, and it hasn’t let up. Quick-service brands are watching average checks grow significantly, likely due to bundle meals and people ordering more to feed families. Meanwhile, the opposite is true for full-service restaurants. You can thank the lack of alcohol sales and beverage attachment.
Data platform Sense360 released data recently that explored this reality further, and where pizza chains fit into the narrative.
As the chart below shows, pizza is witnessing the largest per-dollar order jump of its limited-service counterparts. The transactions drop is also far less severe.
In this next set (which does not include third-party delivery), it shows a decline of nearly 40 percent for credit and debit sales across the industry. Transaction volume fell by almost half, yet average check sizes grew by 16 percent compared to the same week in 2019.
Another culprit at play: A likely decrease in single-person pickup or commute orders meant for a party of one, like grabbing breakfast on the way to work.
But let’s dive deeper into pizza.
Sense360 compared transaction data during the pre-COVID period (January 1 to March 8) to the coronavirus-plagued slice (March 9 to March 29). In the first, pizza spend was close to flat, year-over-year. Like many segments, it was stagnant thanks to an oversaturated landscape.
The green bars illustrate how pizza has trended during the pandemic. Pizza spend is down in every region by 3–9 percent. The best-performing areas pre-COVID-19 have also seen the smallest declines, which suggests that the market characteristics favoring pizza beforehand are the same ones contributing to regional over performance now, Sense360 said.
It’s also important to consider the fact some states in the West and South Central regions were slower to adopt social distancing than others. They’re also the markets that moved away from restaurant usage at a slower rate.
Sense360 broke down individual performance as well, zeroing in on Papa John’s, Domino’s, Pizza Hut, and Little Caesar’s. And it also included MOD and Blaze Pizza to provide a counterpoint with hybrid fast casuals (they typically enjoy far more dine-in business than the “Big 4”).
Papa John’s and Domino’s are weathering the storm so far. For a few of the weeks during the COVID-19 period, they were actually up, year-over-year, in sales. Pizza Hut was down, albeit moderately, while Little Caesar’s reported nearly flat for most of the time period except for the last week of March. The reason Pizza Hut is lagging a bit, most likely, stems from its heavier dine-in presence (about 10 percent).
Papa John’s said Monday it’s hired 5,000 employees since the crisis began. The company added in an email to QSR its donated about 200,000 pizzas to healthcare workers, first responders, and families in need. And on April 17, the company kicked off an unbranded social campaign, #hatsoff, with board members and franchisee Shaquille O’Neal.
“From delivering meals to healthcare workers, first responders and families in need, to supporting the organizations on the frontlines of this crisis, the Papa John’s family has given away more than 200,000 pizzas over the past few weeks, and we are grateful to have served millions of meals more,” CEO Rob Lynch said. “It’s a privilege and our duty to keep our doors open during this time to help feed our communities, all while working hard to ensure the health and safety of our team members and guests. I’m proud of our team and the dedication and hard work they are showing during these challenging times.”
Domino’s provided preliminary first-quarter results on March 30 that backed this data up. The company said “all but a handful of its U.S. stores” remained open and, from February 24 to March 22, compared to last year, domestic same-store sales climbed 5 percent at corporate units and 0.8 percent at franchised (1 percent blended).
The brand expects Q1 sales to rise 1.6 percent. While that would mark 36 consecutive periods of quarterly gains, it would also represent Domino’s lowest number since Q2 2011. Still, it’s in the green.
At Papa John’s, from December 30 to January 26, comp sales leaped 9.4 percent at U.S. corporate stores, 7.1 percent at North American franchises, 7.6 percent systemwide in North America, and 4.9 percent internationally as it charts a turnaround. By the end of Q1, the trajectory of those numbers was affected by the COVID-19 pandemic, but Papa John’s remained in the black. Same-store sales at North American units systemwide grew 5.3 percent. Comps increased 6.1 percent at domestic company-operated stores and 5.1 percent at North American franchises. International units grew 2.3 percent. The only period to dip below zero came February 24 to March 29 when comp sales at international stores dipped 0.6 percent.
All said, those are stellar COVID-19 results, even measured against a soft 2019 when Papa John’s was working its way through customer sentiment issues tied to its breakup with founder John Schnatter.
On the other side of Sense360’s spectrum, MOD and Blaze absorbed much bigger COVID-19 blows. In recent weeks, they’ve experienced drops more aligned with fast casual and even full-service chains.
Sense360 said several points should be considered. Consumers are more focused on value, and the price per serving from the Big Four is lower than it is for MOD and Blaze, understandably. Additionally, the larger chains cater more toward group party sizes, while MOD and Blaze have long crafted models around the individually sized product.
Sense360 added consumers may also be more familiar with ordering delivery and takeout from Domino’s, Papa John’s, Pizza Hut, and Little Caesar’s (historically a takeout-only operation that shifted gears in January). To the value note, Little Caesar’s built a nearly 5,000-unit empire on price points few could rival.
MOD and Blaze also skew more urban in terms of footprint. Previous survey data from Sense360 showed that people in rural areas tend to be more COVID-19 optimistic than those in urban markets. It also doesn’t hurt being able to drive and park outside for contactless, curbside service.
An additional element to consider about MOD and Blaze is that they don’t have a first-party delivery network like bigger chains do. This brings up a question: Are they just down because they’ve witnessed a channel shift toward delivery during COVID-19?
Sense360 looked at DoorDash transaction data to find out.
In this chart, Sense360 found no material channel shift toward third-party delivering happening with MOD and Blaze, at least in terms of DoorDash. The two brands tracked a flat level of market share within DoorDash from the pre-COVID-10 period to now. This suggests third-party delivery is not creating a one-for-one replacement of losses in direct transactions in recent weeks.
Even if it were, the channel is simply less profitable than dine-in and carryout service.
[image source_ID=”127489″]
Sense360 next asked, why is business favoring the bigger chains? It divided transactions in various buckets based on average ticket size.
It discovered that these pizza chains are not created equal when it comes to the distribution of ticket sizes.
For instance, Domino’s gets more than 70 percent of its business from tickets that are more than $18. Blaze and MOD receive more than half from tickets that are $18 or less.
It’s clear that the occasion set and the party size expectations differ between larger chains versus others, Sense360 said.
The company then measured the net change in ticket size distribution due to COVID-19. It defined this as the year-over-year change in March versus their year-over-year change in February, in terms of how much of their business was at the $40-plus price point in terms of ticket size.
[image source_ID=”127490″]
As seen above, Domino’s, Pizza Hut, and Papa John’s have all been the fastest-growing chains in terms of what percentage of their business is arriving from $40-plus ticket sizes. Why does this fit? An increasing number of diners are choosing restaurant food for large party sizes or stocking up so they don’t have to order again for a few days during COVID-19. It’s quickly becoming a cost-effective alternative to loading up at the grocery store, and a way to bridge the gap between bi-weekly trips.
Given consumers’ heightened value focus in recent days, restaurants should consider offering large-party value meals to capture guests who are turning to restaurant delivery, or takeout, for the occasion, Sense360 said.
A larger shift at play
These bigger pizza chains could be staring at significant growth runway post COVID-19. But this is especially true of Domino’s. Papa Johns is still writing a comeback story, while Pizza Hut is the midst of trying to transform its asset base to more carryout, delivery friendly venues.
One thing that’s always separated the pizza segment, as it pertains to counter service, is the fact it’s still majority run by independents (52 percent). And the largest concept (Domino’s) appreciates only 20 percent share of the market.
If independents experience broad closures during this crisis, as it appears they will, there’s going to be a lot of share-of-stomach up for grabs. Not to mention real estate. Brands like Domino’s, Pizza Hut, Papa John’s, and Little Caesar’s will have no trouble turning conversions into profitable off-premises locations, if they so choose that route. Also, unlike independents, they’re going to have cash reserves to jump into growth gaps left behind. Domino’s said in March it also borrowed an additional $158 million to improve its cash position and had $300 million in cash on hand.
Here’s a look at the pizza category market share, which outlines the whitespace.
Domino’s
- Units: 6,126
- System sales 2019 ($MM): $7,050
- System sales 2020 (estimate): $7,700
Share of category
- 2019: 18.7 percent
- 2020 (estimate): 19.9 percent
Pizza Hut
- Units: 7.306
- System sales 2019: $5,500
- System sales 2020 (estimate): $5,350
Share of category
- 2019: 14.6 percent
- 2020 (estimate): 13.8 percent
Little Caesars
- Units: 4,250
- System sales 2019: $3,800
- System sales 2020 (estimate): $3,850
Share of category
- 2019: 10.1 percent
- 2020 (estimate): 9.9 percent
Papa John’s
- Units: 3,142
- System sales 2019: $2,650
- System sales 2020 (estimate): $2,700
Share of category
- 2019: 7 percent
- 2020 (estimate) 7 percent
Total overall:
- System sales in 2019: $19,000
- System sales in 2020 (estimate): $19,600
Share of category
- 2019: 50.3 percent
- 2020 (estimate): 50.6 percent
Domino’s is, arguably, best positioned to ratchet up unit count post COVID-19. The reason is pretty similar to why the higher-performing markets studied by Sense360 continued to outperform.
Simply, Domino’s was already growing. The chain added 141 net U.S. stores in Q4 (146 openings and five closures), and brought 351 net locations to market internationally against just 31 closures. For the year, Domino’s opened 1,106 restaurants.
What’s most impressive about this, however, is the point Domino’s closed only 15 U.S. locations in all of 2019 and has shuttered fewer than 100 total in the past five years combined. This past fiscal calendar, the chain closed 83 international units on a base of nearly 11,000. If you add that to its U.S. movement, Domino’s was sub-100 closures for a 17,000-store global brand.
That’s remarkable really given the lack of industry unit count expansion overall in the past few years.
Also, Domino’s was building out its carryout business to help alleviate delivery concerns brought on by aggregator intrusion. This is going to pay off down the road just as it is currently. People are likely going to remain wary in the weeks and months that follow the reopening of dining rooms. Curbside will be a powerful tool to ease fears.
Domino’s carryout order count was 3.9 percent positive in 2019 on a same-store basis. It was 8.1 percent positive in total across the U.S. system. At the end of Q3, carryout represented 45 percent of total domestic orders.
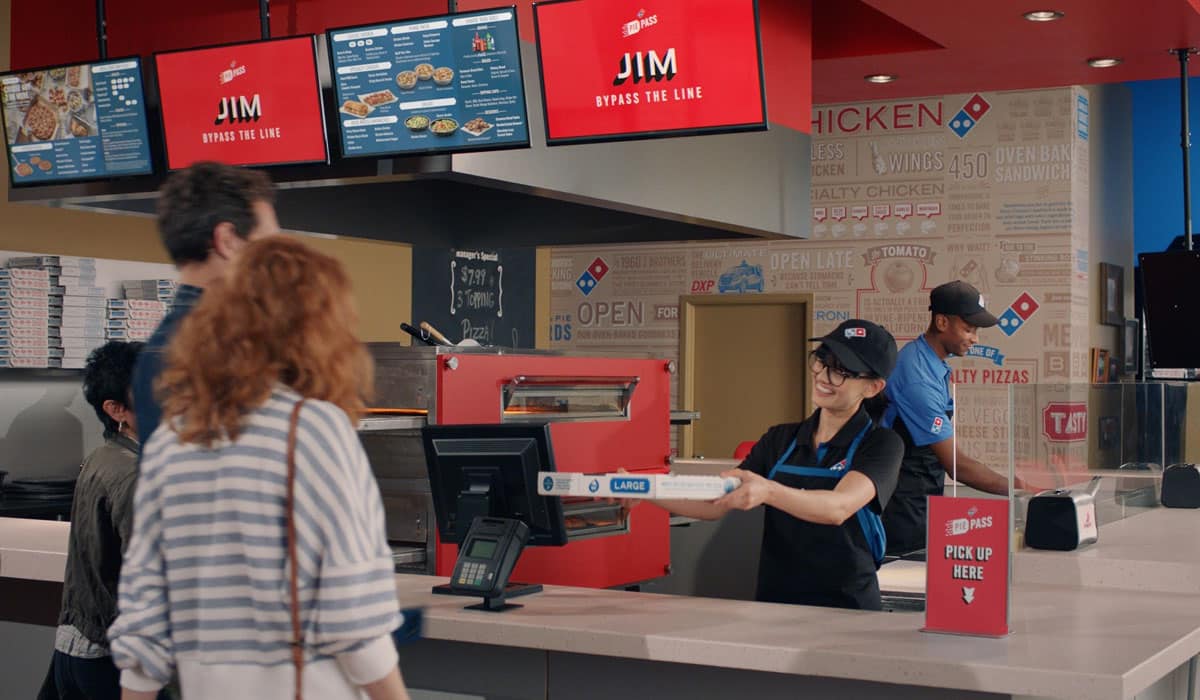
So, while a lot of chains are catching up to this corner of the business, Domino’s was perfecting it heading in. It launched “Pie Pass” technology in February that greets guests by name on digital menuboards. They can pay and order online, or through Domino’s app, and show up at a designated time, avoiding lines.
That kind of block-style pickup is only going to gain in popularity post COVID-19 as people continue to avoid strangers. And to the value side, Domino’s $7.99 carryout construct expanded toward the end of 2019 to include all five of its crust types and is only widening. Domino’s said carryout represents two-and-half times the number of transactions compared to its domestic delivery segment, and more than 600 of its U.S. stores now feature pickup windows.
The brand currently sees a run rate of about 70 percent digital sales—75 percent in some urban markets. Yet this has typically weighed toward delivery. Carryout guests, the company said in Q4, mostly still call the store. That’s why it created the Pie Pass platform—to push people toward digital adoption and the higher checks that often follow (smarter upsells, larger order counts). Could COVID-19 end up accelerating this process? And if so, could it mean even more transactions for Domino’s and a healthier, more profitable mix?
At the ICR Conference earlier in the year, Domino’s laid out some major growth targets. It said it hoped to build 25,00 restaurants and reach $25 billion in retail sales by 2025. Eventually, the brand believes it could run 8,000 stores domestically.
From 2012 through 2018, Domino’s appreciated net growth of 6,172 restaurants across its system. In its top 15 markets alone, Domino’s said it sees potential for an additional 5,600-plus locations. The company laid out a two- to three-year outlook of 6–8 percent global net unit expansion.
Here’s a look at how Domino’s delivery dollar share has grown:
Domino’s delivery dollar share
- 2011: 21.9 percent
- 2012: 22 percent
- 2013: 23 percent
- 2014: 24.4 percent
- 2015: 26.7 percent
- 2016: 27.2 percent
- 2017: 29.3 percent
- 2018: 31.3 percent
The main point being, Domino’s was already on this trajectory and could suddenly have a lot more real estate opportunity on the table. What’s to stop it from getting there?

