
The notion of “phygital,” like many tech headliners, isn’t an invention of the pandemic. Customers walked into physical banks, yet still approached digital kiosks, long before they heard about 6-foot distancing. But what’s accelerated is the fusion. Mobile phones allow consumers to order food and pick where to get it, and how to pay. Car dealerships, doctors, and real estate agents engage virtually before somebody shows up. Hotels are booked and trips adjusted from handheld devices before parties meet at the lobby checkout.
For restaurants, especially those that lead with convenience, it’s a high-stakes evolution. Diners often want the benefits of hospitality—human connection, ambiance, respite—but are entering the funnel through digital means more than ever, whether that’s self-service options, personalized capabilities via order-ahead technology, or virtual checkout.
Tillster recently surveyed more than 1,000 quick-service and fast-casual customers to compile its 2023 Phygital Index report. The aim being to discover what current diners are looking for in their digital ordering experiences, from delivery to kiosks to loyalty, and more.
Starting with kiosks, the self-service devices took a bit of dip at COVID’s onset as high-touch areas became a point of friction for guests and staff alike. But they’ve come back heavy in a lot of chains, especially those seeking to leverage a more profitable channel than most digital interactions. Shake Shack, for instance, exited Q2 with nearly 250 restaurants using the technology. It more than doubled the channel’s sales year-over-year. Shake Shack said it saw an increase of nearly 10 percent in average check compared to front-counter sales. Customers were buying more items per order and paying for higher-priced products. Also, because most of these orders are dine-in occasions, Shake Shack saved on packaging as well.
Holistically, kiosks resonated with customers who could sit and scroll through Shake Shack’s visual offerings at their own pace. CFO Katie Fogertey told investors there’s a higher instance of LTOs (guests can see the product versus reading about it or the brand relying on employees to explain it behind the counter). “I think that when you get to see the very exciting items that we’re promoting up there, guests are interested in that. I think it comes across a little bit differently on the kiosk channel than on our traditional menuboards,” she said, adding there’s also greater incidents of premium cold beverage sales and shakes, which carry a nice margin lift. As Q3 kicked off and the rollout—planned for the entire system and all future builds—continued, Shake Shack posted record kiosk average weekly sales. While that makes sense given there’s more kiosks in the fleet these days, the brand reached a 21 percent operating margin in Q2—a 240-basis-point increase year-over-year and the best mark since 2019. That speaks to why Shake Shack is a full quarter ahead of its schedule to add them to all U.S. restaurants. It’s doubly critical amid today’s pricing climate where customers are scaling back visits, and the economics of third-party delivery pressure value, across the aisle.
So what are customers thoughts more generally on kiosks?
In Tillster’s report, more than a third (34 percent) said they’d like restaurants to have more self-service kiosks available. Forty-four percent of kiosk users noted they were highly likely to use one in the next three months. Forty-two percent of diners, overall, said they’ve used a kiosk.
Similar to other habits triggered by necessity during COVID, kiosks appear to have lasting preference. Of respondents who have used a kiosk in the past three months, the majority were regular users. Eighty-eight percent said they do so at least once a month. Nearly half (47 percent), at least once a week.
Frequency of kiosk usage in the past three months:
- Multiple times per week: 14 percent
- About once per week: 33 percent
- 2–3 times per month: 20 percent
- Once per month: 21 percent
- Less often than once per month: 12 percent
Tillster broke kiosk users down into two buckets—“explorers,” or those who value taking their time to browse; and “beeliners,” described as guests who head to kiosks for speed and convenience.
The company said quick-serves at this juncture need to ensure kiosks can satisfy both cohorts. Explorers want to dive deep into the menu and customize baskets, while beeliners are trying to tap as fast as possible to avoid queuing up beyond other guests.
The common denominator: Each group wants to have the same capabilities of placing an order at the counter, all on a kiosk.
Top reasons diners who have used a kiosk in the past three months prefer to do so:
- 44 percent: Nobody is rushing me
- 41 percent: I can explore more of the menu
- 40 percent: It shows me all the options I have
- 31 percent: It’s quicker
- 27 percent: It’s more convenient
- 24 percent: Easier/more customization
And let’s look at some of the benefits Shake Shack surfaced. Three-quarters of diners said they’ve ordered more items than originally intended when they approach a kiosk:
Frequency of ordering more items than originally intended at a kiosk:
- Regularly: 18 percent
- Occasionally: 56 percent
- Never: 25 percent
Additionally, 59 percent said they were pleasantly surprised by new menu and customization options as a result of using a kiosk. So, to Fogertey’s point, they find something new and interesting by swiping or seeing the interface the brand intended them to, in a dynamic way.
Fogertey added, earlier in the year, this represents a key lever for Shake Shack as it begins to dial up unit growth. Headed into the fiscal year, digital and kiosk sales were up 330 percent since 2019 for the brand, from $147 million to $494 million. Digital guests spend 20 percent more than traditional ones and boast higher frequency.
READ MORE:
Why Shake Shack’s Kiosks are Going to Be a Game-Changer
But migrating diners into the omnichannel isn’t solely a transaction play, she said—kiosks give Shake Shack a tangible way to put a preferred foot forward as the brand enters new markets and looks to drive awareness. Although the burger fast casual is among America’s buzziest, the reality is it still has wide growth ahead. Back in January 2020, pre-crisis, 60 percent of Shake Shack’s domestic units were less than 3 years old. Twenty-four percent had been on the market for 12 months or less. The average age of restaurants across 163 U.S. corporate venues was 2.9 years. Twenty-three of Shake Shack’s 31 markets at the time boasted five or fewer locations.
And it’s no secret Shake Shack tends to carry a higher price tag than traditional, quick-service burger brands. Kiosks give it a chance visually lay out differentiators.
As Tillster put it, kiosks need to be more than just a vehicle for placing orders. Users have high expectations and they want the experience to be as good or better than ordering directly from a cashier. “To encourage increased use, [quick-service restaurants] need to ensure kiosks offer an intuitive user experience and provide features that make the ordering process efficient and engaging,” the company said. “This could include the ability to scan loyalty QR codes, quickly access previous orders, or make personalized recommendations.”
Actions kiosk users expect:
- Customize orders: 86 percent
- Earn and redeem loyalty rewards: 71 percent
- Use multiple language options: 40 percent
- Access previous orders: 36 percent
Overall:
- 77 percent: Expect to be able to do everything at a kiosk they could do at the counter
- 53 percent: Would use kiosks more frequently if there were shorter lines
- 47 percent: Would use kiosks more frequently if there were special offers
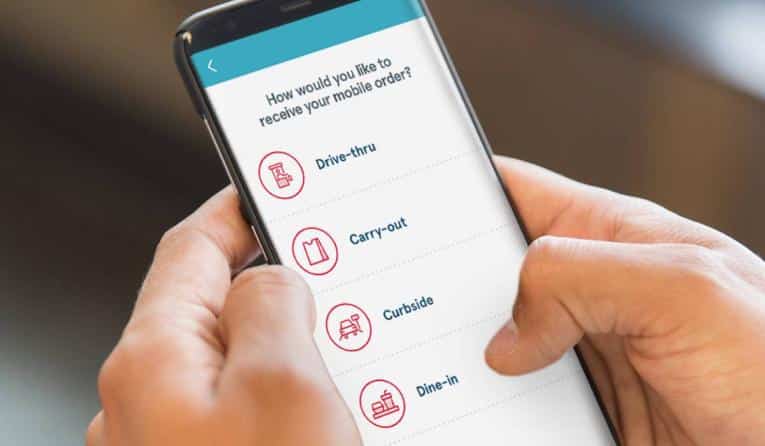
Moving on to mobile
Mobile devices can be painted, in some respects, as handheld kiosks in their own right. Tapping in for dine-in, delivery, or carryout is an expected benefit of the quick-service dining agenda.
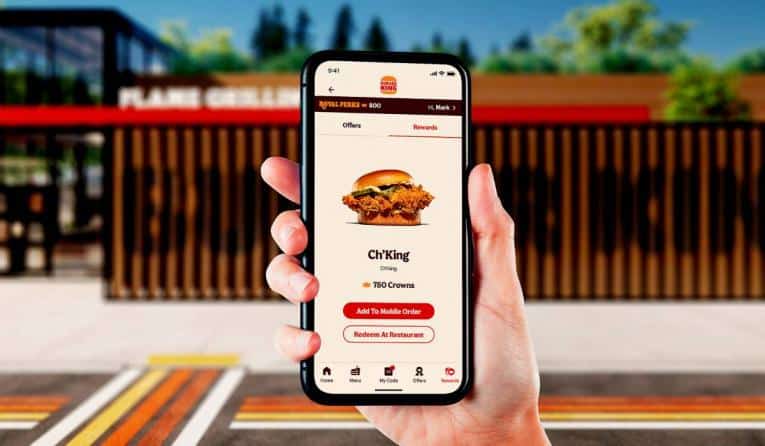
Why are customers heading to restaurant-specific websites/apps (instead of third-party ones)?
- 59 percent: It’s easy to customize orders
- 58 percent: It’s easier/more convenient
- 56 percent: Participation in the restaurant’s loyalty program
- 50 percent: The personalization
Tillster’s trailing five-year data uncovered a noteworthy trend—consumers largely prefer to use a restaurant’s owned channels over third-party solutions. Presently (perhaps due to price), the preference gap is the largest the company has tracked to date.
“[Quick-service restaurants] have a valuable opportunity to convert third-party app users into patrons of their own platforms,” Tillster said. “By doing so, [they] can retain a greater share of their profits and cultivate stronger, direct relationships with their customer.”
- Prefer the restaurant-specific website or mobile app: 71 percent
- Prefer a third-party website or mobile app: 29 percent
- Use multiple language options: 30 percent
- Order through a restaurant-specific app: 41 percent
- Order through a restaurant-specific website: 37 percent
- Use both methods equally: 22 percent
This doesn’t preview the death of third-party, however. The reach, marketing war chest, and ability to pulse value will always attract a user base, as will subscription setups, like Uber One, were a member signs up for $9.99 per month and gains access to savings, perks, and unlimited zero-dollar delivery fee.
Why diners prefer third-party apps over going direct:
- 55 percent: It’s more convenient
- 45 percent: More variety to choose from
- 41 percent: I’m used to their app/website
And why diners use restaurant-specific websites/apps versus third-party:
- 53 percent: It’s less expensive
- 40 percent: It’s more convenient
- 39 percent: For loyalty program benefits/rewards
Tillster also polled consumers on their thoughts about at-the-table ordering, like you often see in McAlister’s, Newk’s, or Chick-fil-A. Essentially, a customer can sit down and order bring-to-table service. This is about as “phygital” as it gets, offering the convenience of digital ordering with the personal touch of table service. It can also free up cashiers and reduce wait times.
Sixty-nine percent of respondents said they’d try a “bring-to-table” service option if presented with it.
In terms of areas of improvement for mobile dining, elevated usage is raising the level of standard.
Top improvements/changes users would like to see in restaurants’ websites or mobile app
- More exclusive offers and discounts: 64 percent
- More customization options: 44 percent
- Faster checkout process: 36 percent
- Better ordering tracking: 35 percent
The procurement journey
The next area Tillster explored was delivery and pickup. Like mobile (and often connected at the hip), customers don’t see either option as novel anymore. Diners have options and plan to use more channels and applications to access restaurants on their own terms.
Using a restaurant-specific website or app for pickup:
- Have done so: 43 percent
- Have done so in the past three months: 31 percent
- Plan to do so in the next three months: 33 percent
Using third-party website or app for pickup or delivery:
- Have done so: 34 percent
- Have done so in the past three months: 25 percent
- Plan to do so in the next three months: 52 percent
Using a restaurant-specific website or app for delivery:
- Have done so: 33 percent
- Have done so in the past three months: 20 percent
- Plan to do so in the next three months: 44 percent
Upward of 90 percent of Tillster respondents said they’ve used these services over the past three months, at least once per month, with fewer customers saying they solely rely on third-party applications for modes of delivery and pickup.
Restaurant-specific website or app for in-store/curbside pickup
- Multiple times per week: 19 percent
- About once per week: 31 percent
- 2–3 times per month: 29 percent
- Once per month: 17 percent
- Less often than once per month: 4 percent
Restaurant-specific website or app for delivery
- Multiple times per week: 30 percent
- About once per week: 29 percent
- 2–3 times per month: 24 percent
- Once per month: 11 percent
- Less often than once per month: 5 percent
Third-party website/app (pickup or delivery
- Multiple times per week: 25 percent
- About once per week: 25 percent
- 2–3 times per month: 28 percent
- Once per month: 15 percent
- Less often than once per month: 8 percent
Specifically to curbside pickup, the option sprung through the COVID pit as a lifeboat option, especially in full service, where you commonly saw casual-dining parking lots morph into makeshift drive-thrus. The model has held ground in fast food.
More than a third (38 percent) of Tillster respondents said the ability to use curbside pickup is still important.
Sixty-nine percent of those who used curbside pickup added they would be more likely to visit a quick-service restaurant that offers the service.
Diners who prefer curbside pickup do so because:
- 52 percent: It’s faster
- 47 percent: Food is still hot
- 47 percent: It’s less expensive than delivery
- 36 percent: Don’t have to interact with as many people
Although delivery and pickup orders continue to prove popular, they boast higher abandonment rates than in-person dining orders. Two of the biggest factors that keep consumers from completing an order, Tillster found, were cost and long waiting times.
- 47 percent: Of consumers have abandoned a delivery order because delivery was too expensive
- 58 percent: Of all respondents said they would be “somewhat interested” in the ability to change their order to curbside pickup if the drive-thru lane was too long upon arrival
Tillster suggested two approaches to improve completion rates. Firstly, operators should consider how to provide customers the flexibility to switch between pickup methods as needed, like offering a single ordering platform that provides time estimates for both options.
Next, quick-serves can present transparent pricing information to help avoid surprises at checkout. They could also consider promoting the cost-value consumers can expect by using their owned channels over third-party apps.
A common denominator
No matter which channels we’re discussing, there was a strong tide toward personalization and loyalty.
How do guests want personalized experiences delivered?
- 53 percent: Email
- 49 percent: Mobile app
- 37 percent: Text
- 20 percent: Website
Thirty-six percent of diners added they’d be interested in trying a personalized menu.
The type of experiences they expect:
- Order customization/loyalty anniversaries: 48 percent
- Receiving tailored loyalty offers: 35 percent
- Remembering my preferred order: 38 percent
- Remembering my name: 30 percent
- Remembering my address(es): 23 percent
Akin to mobile, restaurants have room to get better.
- 21 percent: Have abandoned an order because the ordering experience was not personalized to their preferences
- 20 percent: Feel some level of frustration if they receive offers or promotions that are not relevant to their past orders or preferences.
How often diners received personalized recommendations or promotions (highlighting the runway to remedy that):
- Frequently: 11 percent
- Sometimes: 46 percent
- Rarely: 26 percent
- Never: 17 percent
“Harmonious technology is essentially for effective personalization and loyalty programs,” Tillster said. “Without a seamless integration across channels, [quick-service restaurants] may not be able to collect the data they need to understand their guests’ behavior and preferences.”
Some closing points:
- 56 percent: Are more likely to recommend a fast-food or fast-casual restaurant to a friend or family member based on a positive personalized ordering experience
- 53 percent: Have taken advantage of a personalized loyalty offer
- 51 percent: Have tried a new item due to receiving personalized recommendations
- 42 percent: Are more likely to pay extra to customize a free item