GO TO THE CHARTS:
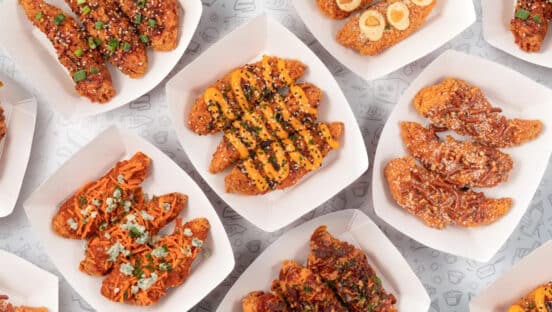
- Chicken
- Sandwich
- Burger
- Pizza
- Global
- Snack
- 50 QSR Contenders for 2023
- The Recap
- Check out the FSR 30
| 2022 Rank | Company | Category | 2022 US Systemwide Sales Millions | 2022 Average Sales Per Unit Thousands | 2022 Franchised Licensed Units | 2022 Company Units | 2022 Total Units | Total Change in Units from 2021 |
|---|---|---|---|---|---|---|---|---|
| 1 | McDonald's | Burger | 48734 | 3625 | 12751 | 693 | 13444 | 6 |
| 2 | Starbucks* | Snack | 28100 | 1680 | 6608 | 9265 | 15873 | 429 |
| 3 | Chick-fil-A* | Chicken | 18814 | 6710 | 2764 | 73 | 2837 | 153 |
| 4 | Taco Bell | Global | 13850 | 1900 | 6734 | 464 | 7198 | 196 |
| 5 | Wendy's | Burger | 11694 | 1973 | 5591 | 403 | 5994 | 56 |
| 6 | Dunkin' | Snack | 11279 | 1200 | 9339 | 31 | 9370 | 126 |
| 7 | Subway* | Sandwich | 10372 | 510 | 20576 | 0 | 20576 | -571 |
| 8 | Burger King | Burger | 10278 | 1508 | 6993 | 50 | 7043 | -61 |
| 9 | Domino's | Pizza | 8752 | 1309 | 6400 | 286 | 6686 | 126 |
| 10 | Chipotle | Global | 8600 | 2800 | 0 | 3129 | 3129 | 211 |
| 11 | Panera Bread* | Sandwich | 6787 | 3230 | 1156 | 946 | 2102 | -33 |
| 12 | Pizza Hut | Pizza | 5500 | 1033 | 6540 | 21 | 6561 | 13 |
| 13 | Sonic Drive-In | Burger | 5499 | 1600 | 3221 | 325 | 3546 | -6 |
| 14 | Panda Express | Global | 5348 | 2385 | 165 | 2193 | 2358 | 87 |
| 15 | KFC | Chicken | 5100 | 1341 | 3872 | 46 | 3918 | -35 |
| 16 | Popeyes Louisiana Kitchen | Chicken | 5001 | 1823 | 2905 | 41 | 2946 | 169 |
| 17 | Dairy Queen | Snack | 4579 | 1063 | 4305 | 2 | 4307 | -32 |
| 18 | Arby's | Sandwich | 4535 | 1300 | 2305 | 1110 | 3415 | 6 |
| 19 | Jack in the Box | Burger | 4111 | 1837 | 2034 | 146 | 2180 | -38 |
| 20 | Papa Johns | Pizza | 3698 | 1169 | 2854 | 522 | 3376 | 37 |
| 21 | Little Caesars* | Pizza | 3520 | 860 | 3599 | 574 | 4173 | -14 |
| 22 | Whataburger | Burger | 3340 | 3725 | 140 | 785 | 925 | 52 |
| 23 | Raising Cane's | Chicken | 3118 | 5440 | 25 | 621 | 646 | 79 |
| 24 | Culver's | Burger | 2830 | 3280 | 886 | 6 | 892 | 56 |
| 25 | Jersey Mike's | Sandwich | 2680 | 1210 | 2379 | 18 | 2397 | 297 |
| 26 | Wingstop | Chicken | 2382 | 1606 | 1678 | 43 | 1721 | 187 |
| 27 | Zaxby's | Chicken | 2380 | 2590 | 776 | 146 | 922 | 11 |
| 28 | Jimmy John's | Sandwich | 2364 | 900 | 2597 | 40 | 2637 | -26 |
| 29 | Five Guys | Burger | 2204 | 1718 | 831 | 578 | 1409 | 19 |
| 30 | Hardee's | Burger | 2020 | 1168 | 1512 | 195 | 1707 | 45 |
| 31 | Bojangles | Chicken | 1600 | 2088 | 501 | 281 | 788 | 15 |
| 32 | Carl's Jr. | Burger | 1555 | 1463 | 1020 | 48 | 1068 | 1 |
| 33 | Dutch Bros | Snack | 1163 | 1924 | 275 | 396 | 671 | 133 |
| 34 | Firehouse Subs | Sandwich | 1154 | 924 | 1149 | 38 | 1187 | 23 |
| 35 | In-N-Out Burger* | Burger | 1125 | 2970 | 0 | 379 | 379 | 12 |
| 36 | Tropical Smoothie Café | Snack | 1075 | 993 | 1197 | 1 | 1198 | 159 |
| 37 | El Pollo Loco | Chicken | 1039 | 2100 | 302 | 188 | 490 | 10 |
| 38 | Crumbl Cookies | Snack | 1004 | 1839 | 687 | 1 | 688 | 363 |
| 39 | QDOBA | Global | 1002 | 1500 | 459 | 269 | 728 | -11 |
| 40 | Shake Shack* | Burger | 994 | 3800 | 33 | 254 | 287 | 44 |
| 41 | Krispy Kreme* | Snack | 991 | 2760 | 57 | 295 | 352 | 44 |
| 42 | Marco's Pizza | Pizza | 968 | 951 | 1023 | 44 | 1067 | 65 |
| 43 | Del Taco | Global | 957 | 1618 | 301 | 290 | 591 | -9 |
| 44 | McAlister's Deli | Sandwich | 956 | 1923 | 493 | 32 | 525 | 20 |
| 45 | Checkers/Rally's | Burger | 858 | 996 | 551 | 255 | 806 | 28 |
| 46 | Freddy's Frozen Custard & Steakburgers | Burger | 808 | 1840 | 427 | 29 | 456 | 36 |
| 47 | Church's Chicken | Chicken | 765 | 935 | 654 | 158 | 812 | -91 |
| 48 | Papa Murphy's | Pizza | 753 | 632 | 1145 | 23 | 1168 | -72 |
| 49 | Moe's | Global | 705 | 1159 | 636 | 1 | 637 | -21 |
| 50 | Baskin-Robbins | Snack | 685 | 300 | 2253 | 0 | 2253 | -54 |
About the QSR 50/
The QSR 50 is an annual ranking of limited-service restaurant companies by U.S. system-wide sales. QSR magazine collected information directly from restaurant companies from March to May 2023, and also partnered with Circana, a leading adviser on the complexity of consumer behavior. Circana leveraged multiple data products and services from its research product portfolio, combined with experienced analyst estimates. Sales estimates represent each chain’s total U.S. system for the year ending December 2022, and were anchored on CREST, Circana’s flagship syndicated study of consumer purchases of restaurant prepared meals, snacks, and beverages. Unit counts source to the fall 2022 release of Circana’s ReCount service, a census of chains and independent restaurant locations regularly updated since 1988. Today, ReCount provides unit counts and trends for over 1.2 million foodservice operators. These primary sources, combined with other proprietary Circana data, public reporting, and analysis, generate this new, industry-standard restaurant ranking.
* indicates figures estimated by QSR and Circana.