When COVID-19 eventually fizzles, the after-shock will linger. It will be the filter restaurants operate, project, and look back through for years. And just like it was days after coronavirus clipped the breaks on dine-in business, this will remain a divergent story.
COVID forced full-service restaurants to reimagine right to the core—how they get food to customers and what they stand for. For quick-serves, though, in some ways, it was like dropping a match into an open gas tank.
Incisiv recently released a report that predicted digital sales will comprise 54 percent of limited-service business within the next five years. What’s staggering about that is it’s a 70 percent increase over pre-virus projections when digital was already coming on strong. Convenience is nothing new for counter-service chains.
This is an optimistic outlook for restaurants. It hints plenty of runway despite the mass digital pivots of the past eight-plus months.
Incisiv, a marketing research firm, found more than 60 percent of limited-service restaurants expressed intent to invest in mobile channels going forward. Amazingly, the overall digital maturity of the industry remains a “low-medium” after perhaps the most tech-centric stretch in the history of foodservice.
To illustrate: While 50 percent of guests prefer paying from a mobile wallet, fewer than 20 percent of quick-serves have provided expanded payment options during COVID, per Incisiv’s study.
Ninety-five percent of guests said they regularly tip delivery drivers. Yet only 32 percent of restaurants presently offer the option of digital tipping. Before COVID, this was 19 percent. So progress across digital innovation has been made. The point is, the cap hasn’t been reached.
Here are some other examples:
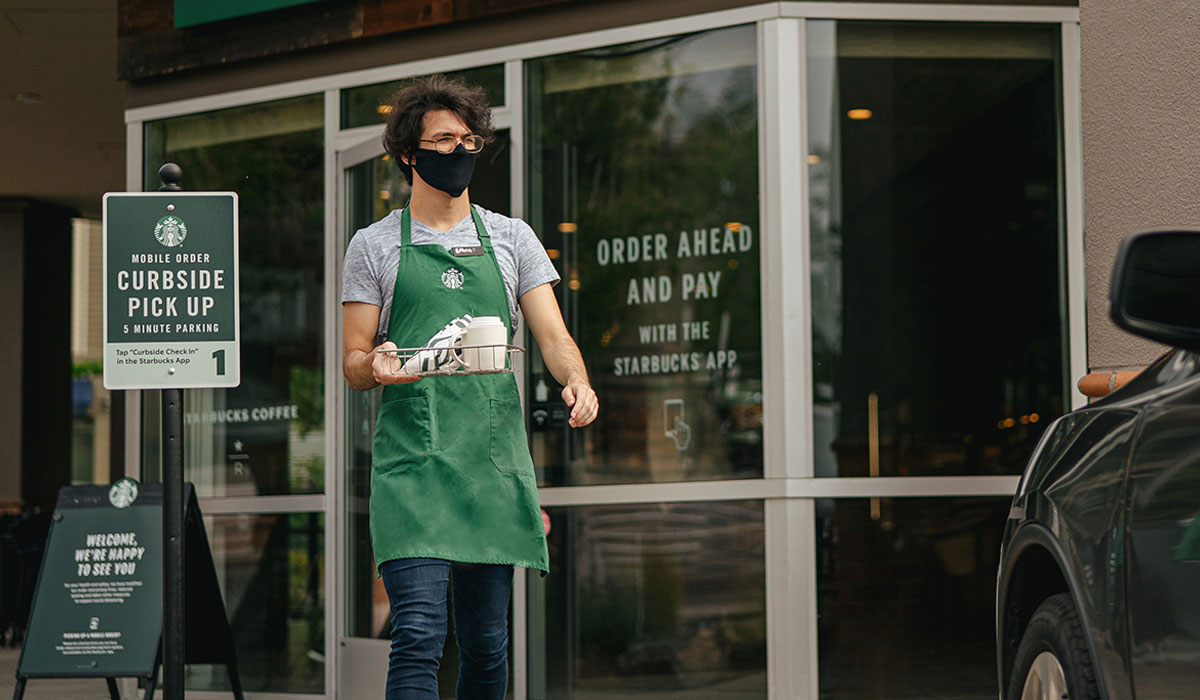
Curbside pickup:
- Pre-COVID: 15 percent
- Today: 71 percent
Use of location tech:
- Pre-COVID: 2 percent
- Today: 16 percent
Dedicated counter for online pickup:
- Pre-COVID: 15 percent
- Today: 26 percent
Home delivery
- Pre-COVID: 38 percent
- Today: 83 percent
There is even more to consider when it comes to customer service, engagement, and adoption potential.
Promotions and deals:
- Pre-COVID: 6 percent
- Today: 20 percent
Contests and games:
- Pre-COVID: 6 percent
- Today: 26 percent
One-touch customer service:
- Pre-COVID: 2 percent
- Today: 35 percent
Incisiv also measured the correlation between “high-digital maturity” and revenue impact amid the crisis. Brands at the top of the list saw a 2 percent decline. Those at the bottom: 10 percent.
More than 70 percent of guests now prefer off-premises dining. This will eventually slide, but it doesn’t change where restaurants can center their points of focus.
Preferred destination post-pandemic
During COVID:
- Restaurant: 15 percent
- Digital order pickup: 25 percent
- Delivery: 39 percent
Post-COVID:
- Restaurant: 38 percent
- Digital order pickup: 28 percent
- Delivery: 31 percent
Preferred channel post-pandemic
In-restaurant:
- Increase: 60 percent
- Same: 22 percent
- Decrease: 18 percent
Delivery:
- Increase: 12 percent
- Same: 64 percent
- Decrease: 24 percent
Mobile app:
- Increase: 32 percent
- Same: 59 percent
- Decrease: 4 percent
Digital fulfillment capabilities are critical in a coronavirus setting, and as saturation settles—quick service touts 80 percent-plus penetration of delivery, for instance—brands will turn to seamless and efficient experiences in the digital arena, taking aim at better guest satisfaction as well as increased order size. Additionally, Incisiv said, efficiency is vital to ensure fulfillment methods are actually profitable.
Before COVID, some of these digital outlets were seen not so much as profit drivers, but as incremental levers or ways to reach new guests, especially via third-party delivery. It was a volume game with the caveat of converting fresh customers into loyal ones. Introduce them to your brand one way, bring them directly onboard another. It’s why so many restaurants invested in technology and marketing tactics to funnel third-party users into direct channels, with lures of more cost-friendly options, like takeout, and the promise of more personalized, incentive-laden experiences down the line.
Today, digital is the lifeblood. And each piece needs to work in tandem, as much as possible.
Some differentiating options guests value, according to Incisiv’s data:
The capability for restaurants to use location technology to receive a prompt for customer check-in.
Contactless delivery.
Real-time order tracking.
Here were Incisiv’s top five leaders in order fulfillment.
- 1. Panera Bread
- 2. Chipotle
- 3. Five Guys
- 4. Pizza Hut
- 5. Little Caesars
More than 50 percent of guests expressed interest in customizing orders. A simple and streamlined process for doing so was a big incentive in Incisiv’s study. Customers also asked for more payment options, namely contactless ones.
What do guests expect?
Incisiv said the option to select the store before adding items to the cart had become table stakes. So is customization options and payment via debit/credit card.
To separate, though, visibility of ETA on a cart page is one option for operators. Customers gave high marks for the ability to add group orders and split an order between friends. They also leaned toward expanded payment options, like “closed loop wallet,” PayPal, pay at store, and pay at delivery.
Incisiv’s top five:
- 1. Panda Express
- 2. Wingstop
- 3. Pizza Hut
- 4. Moe’s
- 5. Jersey Mike’s
We mentioned before the (relatively speaking) whitespace available in digital awareness. “Research and Discovery,” as Incisiv refers to it, has witnessed the least improvement in capabilities since the pandemic. As quick-serves focused attention on scaling fulfillment and ordering options, contextual search and filters leave a lot to be desired, the company said.
Two main areas with room to grow:
Supply chains buckled in for their own COVID roller coaster. Beef supply and the Wendy’s May saga comes to mind. Generally, customers can be forgiving of such setbacks if they understand the challenge in play. Or they’ll head elsewhere to find what they’re looking for. Either way, it’s preferable to a guest feeling left out or deceived.
For instance, limited-service restaurants have weathered sizable variations in item availability compared to pre-virus days. But only 14 percent of restaurants currently offer consumers the visibility, Incisiv said.
Item availability status:
- Pre-COVID: 6 percent
- Now: 14 percent
While 42 percent of guests said they look for online promotions and deals before placing an online order, the feature has not seen much growth in 2020. At least not as much as you might imagine.
A section for offers and promotions:
- Pre-COVID: 51 percent
- Today: 55 percent
Again, despite all the added competition and race for share of digital wallet, there remains ample room to separate from competitors.
“Research and Discovery,” isn’t just about a working search function, Incisiv said. It’s a guide for guests to discover offerings in the easiest manner and for restaurants to provide information and incentives to make a quick purchase with the highest order volume.
“Restaurant chains should look to offer streamlined menu options that highlight time-sensitive promotions, best-sellers, recommendations and preparation details. These are some of the critical customer touchpoints that define an optimal customer experience,” Incisiv said.
What restaurants need:
A menu, naturally. Customers want to view nutrition and allergen information. For operators, the ability to cross-sell is a target.
A home screen to showcase promotions and rewards.
Store information (essential today) to show operating hours and help customers locate venues. When you consider the drop in spontaneous foot traffic during COVID, it becomes a dicey proposition to rely on outdoor signage to drive consistent visits. Quick-serves need to get guest data into their digital flywheel to remarket, inspire repeat visits, and exert control over the guest experience in an increasingly impersonal world.
How to separate;
Filters are a great place to start. Taco Bell, in one example, allows guests to flip the menu to vegetarian. These efforts unlock user-friendly models for guests with allergy concerns or dietary restrictions.
An advanced search that features suggested and phonetic search.
A home screen section for new launches, best-sellers, and a mobile app tour demonstration.
Incisiv’s leaders in “Research and Discovery:”
- 1. McDonald’s
- 2. Starbucks
- 3. Dairy Queen
- 4. Subway
- 5. Sonic Drive-In
Returning to the point of customer engagement in a digital space, there’s evidence guest expectations of service have evolved. People need quality food, sure. But they also want to feel valued and safe. “Limited-service restaurants should provide their guests with additional benefits such as documented safety measures, loyalty programs, offers/promotions and social media integration to ensure repeat visits,” Incisiv said.
Sixty-two percent of guests said they switched brands in the past year due to poor customer service. Digital should give people a platform to voice their issues and be heard.
Table stakes:
Incisiv said today’s consumer demands a sign-up option for offers and promotions. Also (as noted), self-help customer service that includes store contact details, FAQs, and a contact form. They want options to manage preferences and bookmark favorite stores as well.
To separate:
Consider the placement of time-sensitive promotions. FOMO (fear of missing out) can be a selling tool.
Guests desire features that provide recipe suggestions, Incisiv added. This can make them see the app as a resource to return to, not just a selling tool for the restaurant.
An option to select language and provide feedback for delivery.
Incisiv’s top leaders in customer engagement and service:
- 1. Starbucks
- 2. McDonald’s
- 3. Dunkin’
- 4. Chick-fil-A
- 5 (tie): McAlister’s Deli and Auntie Anne’s
Some final numbers
More than 85 percent (86) of the top 50 limited-service chains in the U.S. offer a mobile app that supports online ordering. Forty-three of the 50 did so. Four brands did not, while three didn’t have an app but offered website ordering.
Out of the 43 ordering apps, 91 percent presented the option of delivery via third-party aggregators, with an average of three partnerships per brand.
- DoorDash: 85 percent
- Uber Eats: 82 percent
- Grubhub: 77 percent
- Postmates: 33 percent
- Seamless: 23 percent
Preparing for this digital world remains a work in progress.
“With the rising popularity of mobile ordering, carryout, and curbside pickup, reliability and security are critical for ordering applications and technologies. Order accuracy is especially critical now, because patrons don’t want to physically interact with someone to complain if their order isn’t right,” said Rob Chapman, director of security architecture at Cybera, which co-sponsored the report with Rakuten Ready.
Cathy Novelli, VP of marketing and communications with Rakuten, added restaurants are reimagining brick-and-mortar models as we knew them, all in response to the digital rush. “… with many [like quick-service restaurants] turning into more of a pickup site than a destination. This need has arisen out of the omnipresence of mobile technology as well as to satisfy the rise in consumer expectations of a faster, more seamless order for pickup experience,” she said.
Novelli also expects restaurants to shift focus to what she called “A-commerce,” or augmented commerce. This often leverages voice commands to perform ordering functions previously unavailable. “This is experiencing huge growth and we see multiple use-cases in restaurant environments, including voice ordering meals via car or phone system and notifying employees where you’re parked for curbside pickup, all powered by customer geo-location,” she said.
The overall rankings from Incisiv:
- 1. Starbucks
- 2. Panera Bread
- 3. McDonald’s
- 5. McAlister’s Deli
- 5. Pizza Hut
- 6. Domino’s
- 7. Chipotle
- 7. Moe’s
- 9. Panda Express
- 10. Qdoba
- 11. Taco Bell
- 12. Marco’s Pizza
- 13. Jimmy John’s
- 14. Wingstop
- 15. Papa John’s
- 16. Five Guys
- 17. Auntie Anne’s
- 18. Jersey Mike’s
- 19. El Pollo Loco
- 20. Dairy Queen
- 21. Subway
- 22. Chick-fil-A
- 23. Popeyes
- 24. Little Caesars
- 25. Sonic Drive-In
- 26. Steak ‘n Shake
- 27. Del Taco
- 28. Tim Hortons
- 29. Dunkin’
- 29. Whataburger
- 31. Baskin-Robins
- 32. Papa Murphy’s
- 33. Tropical Smoothie Café
- 34. Wendy’s
- 35. Firehouse Subs
- 35. Jason’s Deli
- 37. Shake Shack
- 38. Zaxby’s
- 39. Carl’s Jr.
- 40. Burger King
- 41. Jack in the Box
- 42. Church’s Chicken
- 43. Culver’s
- 44. Arby’s
- 45. In-N-Out
- 46. Raising Cane’s
- 47. Bojangles