

Bojangles announced a new Vice President of Real Estate. Steven Gold, the new VP of Real Estate, brings more than 30 years of experience in development to the Bojangles team. Gold boasts an impressive background in real estate development, most recently, for multiple retail, hospitality and restaurant brands, including multi-unit program development for FOCUS Brands […]
Scooter’s Coffee is honoring healthcare heroes in our communities with a free drink for any nurses and healthcare workers, with ID, on May 3, 2024. The offer is redeemable only on Friday, May 3, 2024 for any drink on the Scooter’s Coffee menu of any size for customers who present a valid healthcare ID. The first 50 […]

PJ’s Coffee is expanding a true taste of New Orleans in the City of Katy with its second location in the area at 1185 Katy Fort Bend Road beginning Monday, May 6. Right off I-10 and down the street from Memorial Hermann Katy Hospital, to celebrate with the community, PJ’s will offer guests a free beignet […]


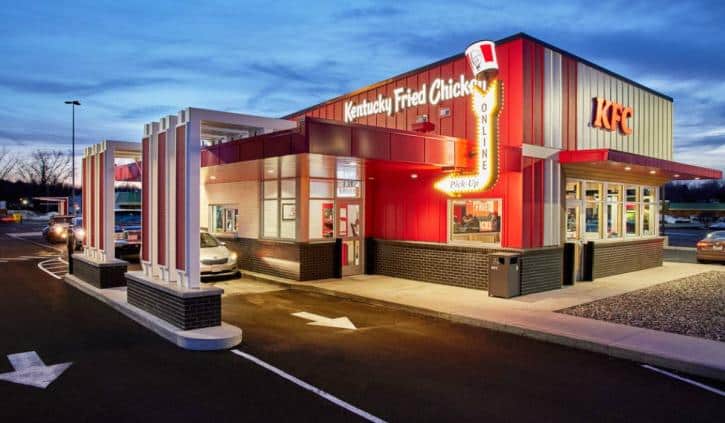
Life is Good, the original positive lifestyle brand, is teaming up with KFC, the original fried chicken brand, to create a limited-edition capsule collection, available on KFCShop.com and lifeisgood.com starting Thursday. The line will unite the iconic branding of the world-famous chicken chain with Life is Good’s signature uplifting designs, all delivered on the high-quality […]
Toppers Pizza is expanding throughout Wisconsin with a new restaurant at 1602 S. Church Street in Watertown. Opening on Thursday, April 25, the new Toppers is located near the Watertown Municipal Airport next to Cricket Wireless and Great Clips. It’s the first Toppers store owned by franchisees Ahmad Khadeejeh and Mahmoud Rayyan. Toppers will celebrate its Watertown […]
Taco John’s Bigger Bolder Rewards Members get a free beef Taco Bravo with any purchase of $5 or more on May 5. The Taco Bravo elevates the classic Crispy Taco by wrapping it inside a warm flour tortilla layered with soft refried beans. Each Crispy Taco shell is cooked fresh in-house every day, then filled with Taco John’s signature 100% American […]
Guests summoned, we answered. Carl’s Jr is giving into guests’ cravings with the infernal return of the devilishly spicy El Diablo burger. Starting today, the cult-favorite menu item, featuring two charbroiled all-beef patties, two strips of bacon, crispy Jalapeño POPPERS Bites, melty pepperjack cheese and fiery habanero ranch sauce on a seeded bun, will rejoin […]
Domino’s brought you Carryout Tips. Now the largest pizza company in the world, known for its value innovation, is launching You Tip, We Tip – a promotion that tips customers who tip their delivery drivers, beginning April 29. “Domino’s drivers have been hustling to deliver hot, delicious pizzas since 1960, and we love that customers […]
Subscribe to A.M. Jolt
"*" indicates required fields